The season is over, the carts are stored away, the lockers have emptied, the greens are quiet and you’ve shuttered the clubhouse. It’s time to do some maintenance, take a little break and consider new strategies for next year.
But before looking ahead, you have to look at the season that has passed. It’s time to review this year’s performance, recognize what went well and find solutions for areas of improvement. From understanding how food and beverage sales performed over the year to reviewing inventory and sales in the pro shop and analyzing course occupancy rates throughout the year, as an Owner, Director and/or Manager, you definitely have your work cut out for you.
We’ve put together this handy guide detailing tips and strategies to make the year-end review go smoothly.
- What can your customer data tell you about your performance?
- Were your marketing initiatives effective?
- What occupancy KPIs should you look at?
- How well did your F&B & pro shop operations perform?
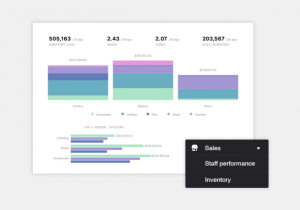
The Ultimate Guide to Pro Shop KPIs
A good use of KPIs can make the difference between a pro shop that reaches the break-even point and a profitable shop.
What can your customer data tell you about your performance?
Knowing exactly who is playing at your course has many benefits, especially at the end of the year when you’re analyzing what changes have occurred in your customer audience.
To get high-quality analysis, robust customer relationship management (CRM) software is necessary. CRM technology is now capable of tracking and managing highly detailed data on your customers. With a high-quality customer data set, golf courses that are conducting a year-end review can review key metrics to understand where operations can be optimized.
How did your customer demographics change this year?
One of the most common challenges faced by golf course owners today is attracting younger golfers who aren’t necessarily as interested in golf as older generations. Attracting new customers is a common goal of managers, so it’s important to look into how many young players frequented your course in comparison to last year.
Segmenting your database by age can dramatically help with this in terms of using
your CRM software to provide meaningful data. This can help answer questions like:
- How many more junior members and public juniors are there since last year?
- Do they only play when tee times are discounted?
- What booking channel did they use?
- How many came back for a second round?
- What is the average number of rounds each kind of player played?
- What are they purchasing in the pro shop?
- What restaurant menu items do they buy?
- What drinks do they order at the bar?
- Who do they golf with?
How are you keeping your loyal customers and generating more of them?
How well did you engage new and longtime customers this year? If your loyalty program is supported by software, you can put the vast amount of data it collects to use. Check and see how much revenue you generated from your most loyal top spenders and see if there are any ways you could have generated incremental revenue from them.
Most importantly, take a look at your new customers, the ones who visited for the first time this year. How many times did they come back? What tee times did they show a preference for? Did they spend it at the restaurant or pro shop? These insights will provide direction for your future marketing efforts as you nurture your new customers and try to draw them back next year.
According to the 80/20 rule, 20% of your customers will generate around 80% of your revenue. This 20% percent represents your most loyal customers, so it’s important to show them how much you appreciate them while also trying to find ways to grow this core revenue segment as much as possible over the course of the year.
Were your marketing initiatives effective?
A lot of managers shy away from engaging in marketing activities because they don’t believe it will produce a good return on investment (ROI). However, golf course managers who engage in the right mix of marketing activities, know who they’re targeting and track performance have found ways to generate great returns on investment. It’s all about knowing your audience, engaging with them in a way that effectively reaches them and then tracking the performance of your advertisements and making subtle changes as you move along the campaign.
Effective audience engagement
Having the right mix lays the groundwork for engaging your audience. Once you get to this step, it’s time to ask yourself which initiative is reaching who, and then look at ways to optimize.
Print ads tend to reach older demographics (50 years old and above) that still read a print newspaper on a daily or weekly basis. You can surgically track the effectiveness of the ad by adding a unique promo code that can be redeemed easily over the phone or through online reservations on your website.
Digital marketing is more likely to reach the younger demographic (45 years and below), especially when done through Facebook, Instagram,Twitter and TikTok. In this sphere, there is a wide range of ways to ensure effective audience engagement. Facebook and Instagram have a very robust targeting system that can target an audience with laser-beam precision. Twitter is an excellent way to create and communicate with an audience of people who are already interested in your golf course, and it also can help with communicating information about course-related events, closures, and changes.
What occupancy KPIs should you look at?
It is of the utmost importance that golf managers understand how and when the golf course is being used. These kinds of metrics inform key decisions around pricing, opening and closing times, staffing needs and overall course performance year over year.
Consider these 5 key metrics that course managers often find useful.
1. Occupancy percentage (OCC %)
This metric answers a simple question: how full are you?
Since your assets expire every ten minutes, it’s vital to know how much of your inventory you are moving. Don’t forget to factor in staff and comp rounds, as they take up just as much space on your greens as paying customers. This metric is the first look into where your course stands.
Calculation: All rounds played ÷ all available rounds (capacity)
2. Revenue per available round (RevPAR $)
For course management, this performance indicator is the most important regarding managing revenue.
Unlike average revenue per round sold, this metric is a much more realistic measure of the value of each tee time on your tee sheet because it factors in all of your available inventory. A golf course that sells a few overpriced tee times on a given day can have the exact same revenue per available round as a golf course that sells too many inexpensive tee times. Managers who want a realistic idea of the value of their green fee inventory should consider this metric, instead of the average revenue per round sold metric.
Calculation: All green fee-related revenue ÷ all available rounds (capacity)
3. Channel mix percentage (CMIX %)
Channel mix percentage looks at which channels are producing how many bookings.
In the new golf economy rounds aren’t just booked over the phone. They come from online booking services and third-party sources. As golf managers make decisions about their booking solutions, whether it be through online, third party or pen and paper, knowing where round bookings are coming from can tell a lot about how many rounds you’re giving to third-party providers and how players interact with your course.
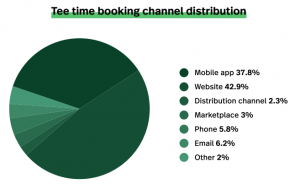
Calculation: Rounds booked direct ÷ all rounds
4. Average rate per round (ARPR $)
This key performance indicator is possibly the most standard number most course operators look at. It is especially helpful when looking at certain days of the week and times of the day.
Knowing whether your customers are willing to pay more for a primetime tee time or if they are looking for the less expensive green fees later in the day can help inform revenue management decisions and determine how well your course is performing. Consider looking at average revenue per round across player categories as well. Using this metric with the revenue per available round metric gives an excellent picture into the value of specific tee times at your course depending on the season and time of day.
Calculation: All green fee-related revenue ÷ all rounds played
5. Occupancy by time range and day
Occupancy by time and day takes the occupancy percentage metric one step further and looks at occupancy over large date ranges or specific times of the day. This metric can help answer if the most sought-after tee times were charged at a premium.
Did an overpriced tee time at a certain time of day reduce occupancy? Which days are you getting the most and the least business? How did you perform compared to last year? Getting pertinent data that answers these questions can concretely inform pricing decisions as golf managers adjust between seasons.
How well did your F&B & pro shop operations perform?
When the year ends, managers can be left wondering how their restaurant and pro shop operations performed over the course of the season. Often, managers will turn to reports made available to them by their POS system as they are vital touchpoints in any golf operation. You can learn a lot about your yearly performance by analyzing the following metrics.
1. Employee sales
A common theme within golf course management is the high amount of churn managers face within their staff. A rotating cast of employees causes the risk of hiring ineffective employees, raising the cost of training while hurting performance on the course and in the pro shop.
Analyzing the sum of sales data per employee at the end of the year can help with year-end performance reviews, show which employees are worth bringing back next season and help determine who is worthy of a raise.
2. Inventory turnover
One key performance indicator that is particularly important at the end of the season is the inventory turnover ratio. This statistic indicates how many times the entire inventory was sold over a given period. By comparing the ratio of your course to the industry average, you can get an idea of how well your inventory is performing in relation to the competition.
Calculation: Yearly cost of goods sold / yearly average inventory
3. Menu and item sales
Managers in the pro shop and restaurant need to know whether their menus and product inventories consist of an attractive offering for their customers. At the end of the year, golf managers must understand what items did well on the floor and which ones should not be re-ordered for next year.
Profit margin trumps all, so don’t get too caught up on volume alone. Unless you’re running special promotions, it serves no purpose to carry inventory that doesn’t generate a return.
4. Yearly stock levels
Counting stock can be a tedious process, but it’s important to do, especially if you want to know shrinkage rates in your pro shop and bar.
Managers need to be certain that they are comparing their year-end stock count against a reliable expected inventory count. Using POS software that facilitates this can save you precious time with retrieving a reliable count and facilitate the re-ordering process.
Are you ready to set some goals for next year?
The year-end review is done. You look at all the numbers and you have a clear understanding of where you did well and how you can improve.
Now it’s time to look to the future and set some goals for where you want to be next year. Aside from the obvious goals like improved sales and profits, think about where your sales come from and set clear and specific goals based on all the information you’ve been able to gather.
A good goal to set for next season would be increasing junior memberships by 5% or generating 5% more revenue from your most loyal customers. Maybe your occupancy rates are low and setting a goal such as achieving an average of 75% occupancy per week is necessary. Or, perhaps you need to set new goals and standards in the kitchen or pro shop in order to improve employee behavior and inventory performance. There are many goals that can be made, and the best part is that it’s completely up to you to decide what you’ll work on improving next year.
Looking to bring your golf course to the next level with powerful technology and data-backed strategies? Talk to one of our experts today to find out how Lightspeed can help your facility.

News you care about. Tips you can use.
Everything your business needs to grow, delivered straight to your inbox.