How to track the numbers that matter most to your overall business performance? As a golf course operator, you know your numbers. You know when you’re up and you know when you’re meeting budget. But these numbers don’t tell the whole story about your business performance.
To truly understand the health of your business, you need to compare your performance to the wider market. That’s why rounds and revenue benchmarking is so critical to your business.
In the game of golf, players improve by posting their scores and comparing it to other players – the same principle applies to your golf course’s performance.
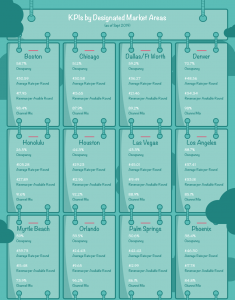
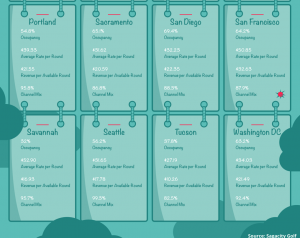
In this resource, you’ll learn about the key performance indicators related to your green fee revenue; why they matter; and how to calculate them. Finally, you’ll see the average KPIs for North America by DMA, plus the national average, so you can see how your numbers compare.
Introducing your key performance indicators (KPIs)
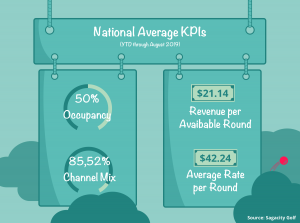
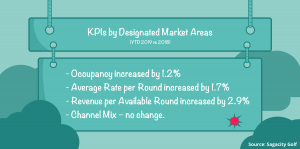
There are four key performance indicators (KPIs) related to green fee revenue: Occupancy, Average Rate per Round, Revenue per Available Round and Channel Mix. Tracking how your KPIs change each month gives you insight into how your business is performing.
Occupancy Percentage
This KPI measures how full your golf course was last month.
How to calculate it: Divide all rounds played by all available rounds. (A round played is any round checked-in on the tee sheet, whether nine holes, 18-holes, comp, barter, etc.) To count your available rounds, start 25 minutes after sunrise and end 4.5 hours prior to sunset. This number will change seasonally.
Why it matters: Occupancy is an important factor in calculating your revenue growth. A variety of factors can change your occupancy percentage. Some factors are out of your control, like the weather, competition and the economy. Other factors are a direct result of an action you took, like changing a rate or course condition.

Average Rate per Round
This KPI is your average green fee revenue for rounds played.
How to calculate it:
Divide all green fee-related revenue by all rounds played. (Green fee-related revenue includes green fees, cart fees, prepaid green fees, annual pass, membership, access or loyalty card revenue.)
Why it matters: Average Rate per Round is most helpful when showing the amount paid by golfers, especially during certain days of the week, certain times of the day and by specific rate categories of golfers.

Revenue per Available Round (RevPAR)
This is the most important KPI – it measures your revenue growth by calculating how well you’re monetizing your available inventory. Unlike Average Rate per Round, RevPAR factors in ALL your available tee times – not just the ones that sold.
How to calculate it: Multiply your Occupancy Percentage by your Average Rate per Round.
Why it matters: You measure revenue growth through the change in RevPAR. The goal is for your RevPAR to increase. (If it goes down, you’re revenue is decreasing.) To increase your RevPAR, you either need to get more people to play, or to increase your rates.

Channel Mix Percentage
This KPI tells you how many rounds were directly booked with your course versus 3rd party sites like GolfNow and TeeOff.
How to calculate it: Divide your rounds booked direct (via website, mobile app, telephone, call center and walk-in) by all rounds.
Why it matters: A high Channel Mix percentage means the majority of rounds are being booked direct – these rounds typically have a higher-yielding green fee amount. Rounds booked direct also come with the additional benefits of a direct relationship with your customer.

How to track your KPIs each month
The power of benchmarking is in tracking how your KPIs change each month – the numbers don’t mean a lot on their own. Your business is always either expanding or contracting throughout the year. Benchmarking KPIs give you clear insight into how your business is doing.
For example, RevPAR is calculated with your Occupancy & Average Rate. If your rates are up but occupancy as a result goes down, your RevPAR may decrease – indicating that your rates need to be adjusted.
If you have a low channel mix percentage, that shows an opportunity to increase revenue by driving more direct bookings for your golf course. You could offer an incentive for golfers who come in via 3rd party websites to book direct with you next time.
About Benchmark, by Sagacity Golf
See how your numbers stack up with Benchmark, the only independent and validated benchmarking platform in the golf industry. Created by Sagacity Golf, Benchmark is a quick and easy way to check the health of your business and compare performance with your competitors. Today, 800+ courses are participating by confidentially contributing their data to Benchmark. To learn more, visit their website.

News you care about. Tips you can use.
Everything your business needs to grow, delivered straight to your inbox.