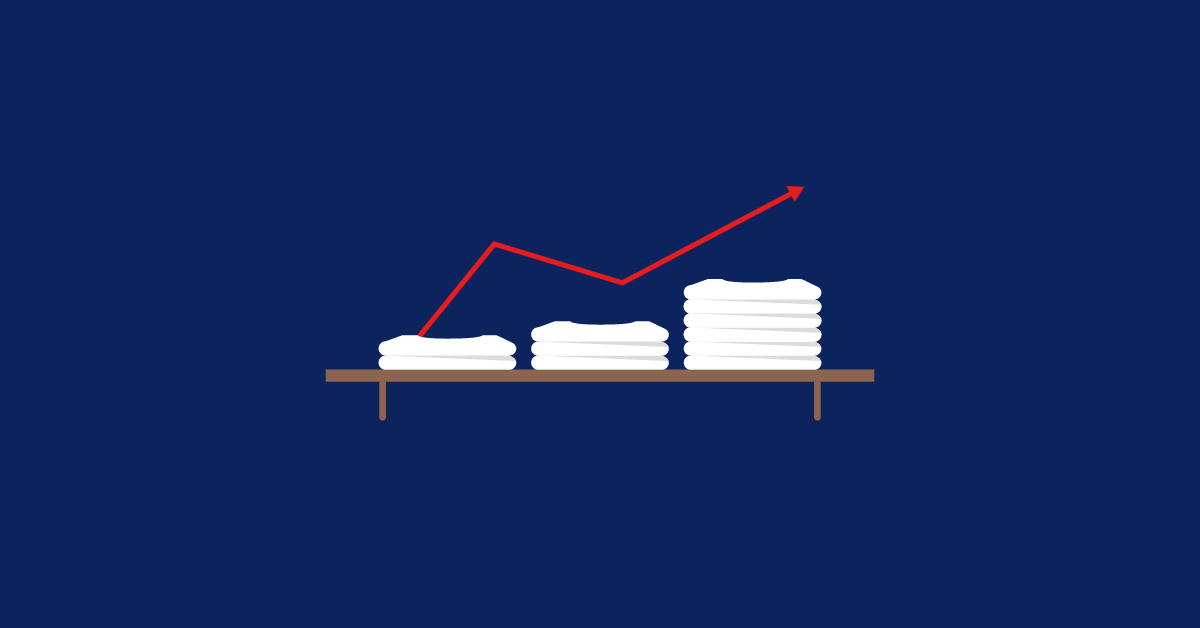
Having too much stock on hand is a financial burden on your retail business. Slow sales means less ability to cycle in newer inventory that does land with your customers, because your revenue is tied up in inventory that isn’t going anywhere.
Just as bad, though, is having not enough stock on hand. If you can’t fill the demand, a competitor can, and so you’ll have lost potential sales.
With accurate inventory forecasting, however, you can ensure you always have just enough stock. Luckily, getting started with inventory forecasting isn’t hard—as long as you’re working with a point of sale system that helps you track and measure data.
In this post, we’ll go over:
- What inventory forecasting is
- Why inventory forecasting is important
- Qualitative vs. quantitative inventory forecasting
- Best practices to perfect your inventory forecasting
- The perks of inventory forecasting software
Get your free inventory management spreadsheet
Our experts have put together a template spreadsheet with built-in formulas. Just enter your data and watch it calculate everything for you.
What is inventory forecasting?
Inventory forecasting is the practice of using data—sales data, surveys, market research and more—to predict what will sell, in what quantities and in what span of time. In other words, inventory forecasting (also known as inventory demand planning) helps retailers decide what they need to have in their stores.
With inventory forecasting tools, you can:
- Predict seasonal demand
- Set data-driven sales targets for new products
- Optimize stock on hand
- Spend less on what doesn’t sell, and more on what does
Why is inventory forecasting important?
Without inventory forecasting, you’re just making guesses. Even if you (or your store managers) run the numbers regularly, trying to keep up with every possible variable in order to be agile and effective will eat up most of your time. You need forecasting tools to do the heavy lifting for you, so you can focus on the action, not the information gathering.
For example, accurate inventory forecasting enables just in time stock management, where you receive orders from vendors right when they’re needed, no sooner and no later. Because demand fluctuates (thanks to seasonality, changing consumer opinions, competition and other factors), dynamically updating data helps properly forecast ideal stock levels and avoid empty shelves.
Inventory forecasting methods
Using the correct demand forecasting method to keep your inventory adequately stocked is essential. With how buying patterns have changed, though, inventory projection is a little more complicated.
Traditionally, merchants could look at their sell-through rates and sales reports to see which stock they should order more of and how much they should order.
Now, thanks to compounding factors like supply chain uncertainties, shortened product lifetime cycles and waxing and waning consumer confidence, inventory forecasting methods are more likely to be a mix of both quantitative and qualitative information.
Rather than rely too heavily on one or the other, you’re likely better off using both.
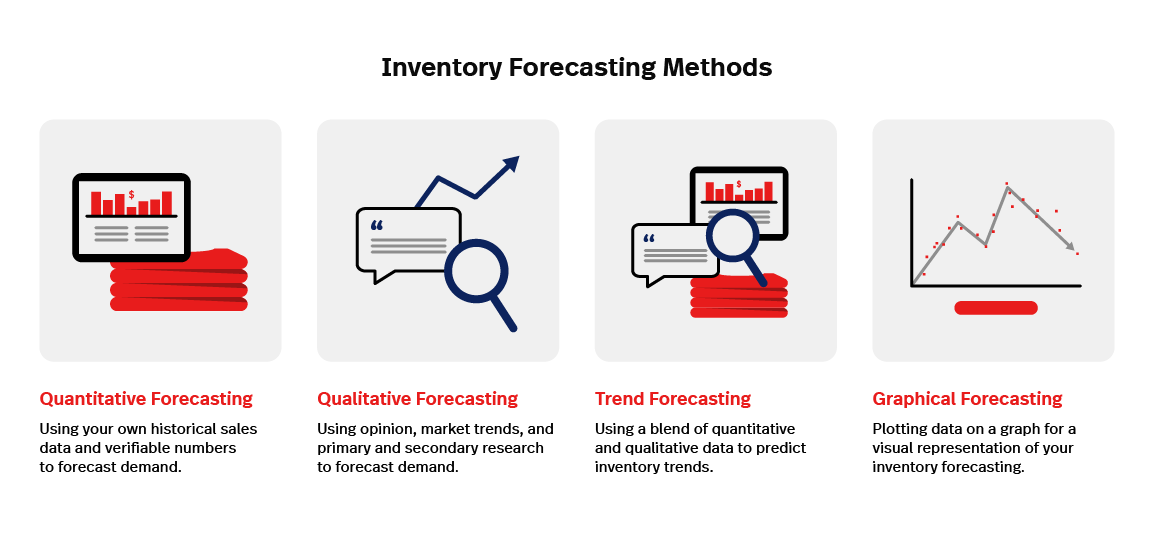
1. Quantitative inventory points and forecasting
Quantitative inventory forecasting primarily relies on historical sales data found in yourpoint of sale system. The longer you’ve been tracking sales data, the larger your data set was and the more accurately your predictions would be. For instance, a few years of sales data gives you an idea of seasonal trends.
In recent years, we’ve seen a boomerang effect in hospitality with a continued positive momentum as diners revel in the return of togetherness. However, with two on-going wars, an economic recession looming in large parts of the world and a spike in inflation and interest rates—restaurants are feeling the impact of cautious consumer spending. The good news is technological advances allow businesses to capitalize on growing trends, like consumer preferences and sustainability, offering a more accurate and nuanced view of buying patterns that allow for agility in the face of uncertainty.
Inventory forecasting tools that rely on your past sales data alone don’t always tell the full story. That’s not to say that quantitative forecasting isn’t useful. It’s one of the most concrete ways you can measure demand, and serves to explain qualitative forecasting. If you have to pick between quantitative and qualitative tools, go quantitative every time.
However, it serves to be cautious and agile, planning for the long term but not over-committing until you’re sure and ready to pivot as needed.
If, for example, you’ve noticed that sales for a product or category have steadily increased over the past 6 months, it may be safe to order higher volumes of that product. If, however, sales have been steadily decreasing for a certain product or category, you might want to hold off on including them in your next purchase order, even if in the past those declines have reliably turned around. (Instead, try out a new pricing strategy or store layout to see if your existing stock moves any faster.)
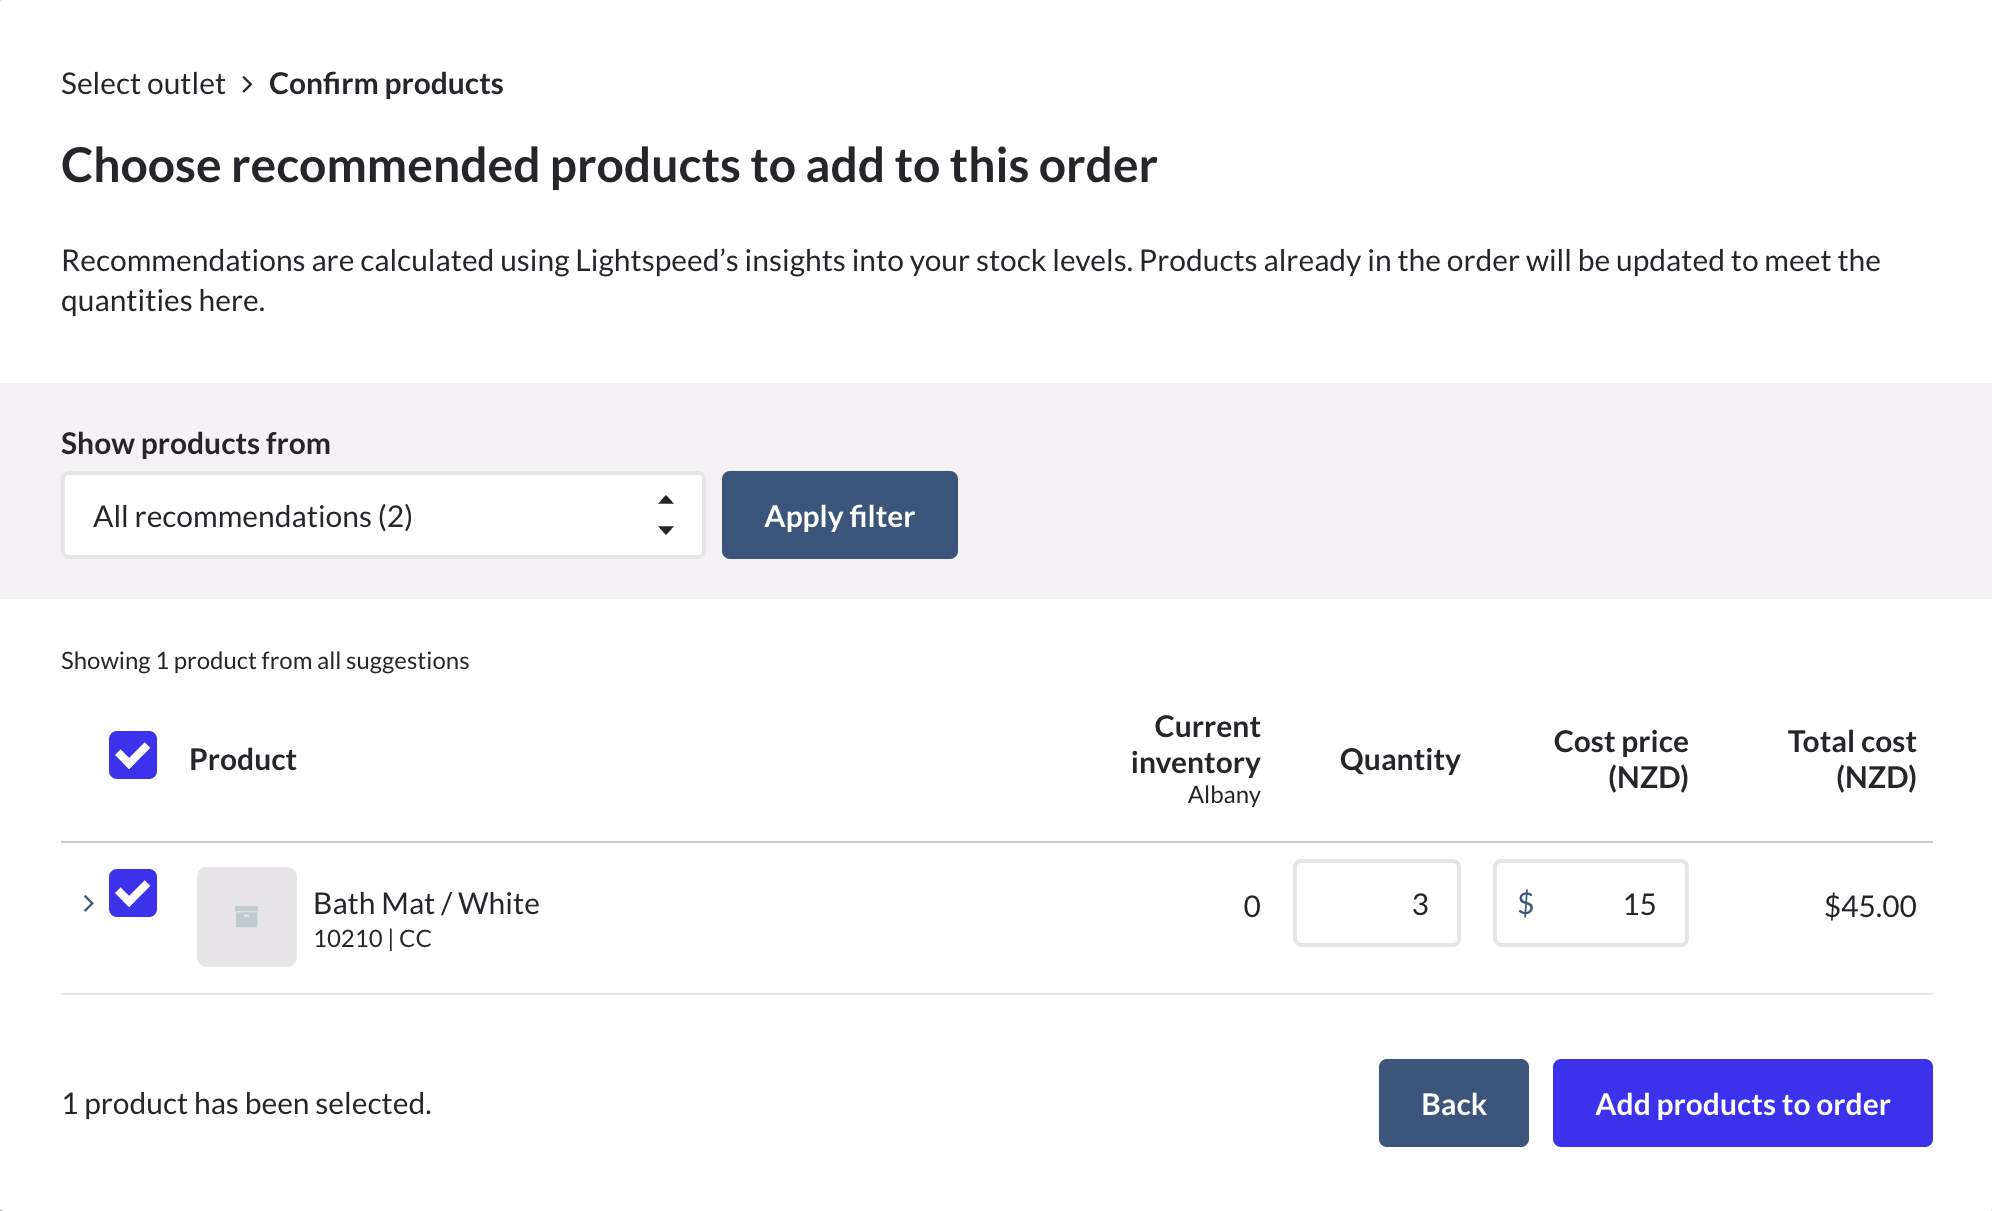
Luckily, Lightspeed Insights takes the guesswork out of assessing your inventory. You can drill down into data by SKU, brand or product type and see a top down, nuanced view of what’s selling. Whether it’s a fast moving item that underscores a larger trend happening or a previously out of stock item that led to missed sales, Lightspeed Insights provides suggested order quantities based on your business data.
2. Qualitative inventory forecasting methods
Qualitative inventory forecasting relies less on historical data. You may need to use qualitative forecasting when you don’t have a lot of sales data to draw on to make accurate predictions.
Qualitative forecasting is useful when you don’t have enough data to reasonably make an educated guess, like if you opened your store three months ago and only just started collecting sales data. It’s also useful to look at qualitative information when external events have drastically changed how consumers buy, such as store closures.
Instead of sales data, qualitative inventory forecasting relies on wider market trends, expert opinions and both primary and secondary research. If quantitative forecasting is using data to come up with a measurable answer, then qualitative forecasting is using available information to make an educated guess.
It also helps you to react to sudden changes in inventory demand that your historical data may not help you adjust to, like the impact social distancing had on consumer’s shopping and spending habits, how inflation can change shopping patterns or how a new competitor disrupts your industry.
Ultimately, though, merchants should use a balanced mix of quantitative and qualitative information in their inventory forecasting.
For example, use quantitative information to re-order stock that’s a surefire best-seller and use qualitative information to buy lower volumes of inventory you’ve never carried before. Or, use quantitative forecasting to pick the brands you want to pursue a deeper relationship with, and qualitative forecasting to decide what new product lines from that brand you want to carry.
3. Trend inventory forecasting
Trend forecasting is a type of inventory forecasting where you take the long view of what sales trends your products are going through to predict where they’ll go in the future. With trend forecasting, you recognize sales are rarely the same every year, and try to identify what factors—beyond seasonality—will influence spikes and dips.
Trend forecasting blends qualitative and quantitative data to arrive at an answer, like:
- Your sales data, which tells you month over over and year over year how products are trending
- Social media chatter, wherein you see what products are catching eyes and what’s considered passé
- Investment trends, where you take into account what types of products and businesses are seeing the most investment, and what investors are losing interest in
- Customer and store count, where you consider your reach in comparison to your sales
- Shipping timelines, and how they might be growing or shrinking year over year
Trend forecasting is less about knowing what quantity you need to order next week and more about knowing what you should be putting your energy into in the first place.
A solid reporting system does the heavy lifting when it comes to inventory forecasting. With Lightspeed Insights, you get ‘everything in’ reporting you can customize to meet your specific needs—pick and choose what you want to report on and when. Better still, if you have stakeholders these reports can be saved, scheduled and shared easily for your team to see the big picture and weigh in.
4. Graphical inventory forecasting
Rather than being a totally different type of inventory forecasting, graphical forecasting is an application of the data from your other forecasting methods.
It involves plotting (typically quantitative) data on a graph, commonly a line graph. This may make the data easier to understand and, as such, can help your organization move forward in making decisions with everyone on the same page about your numbers.
How to perfect your inventory forecasting
Forecasting inventory doesn’t just mean looking at sales data and calling it a day.
Remember: you need to balance quantitative data with qualitative research! To perfect your inventory forecasting during unpredictable times, keep these practices in mind:
- Research what your customers want and need
- Determine your forecasting period
- Stay on top of reorder points
Research what your customers want and need
Flex your qualitative prediction muscles by directly reaching out to customers to learn what brands and products they’d like to see you carry. Research from Sprout Social suggests that, when a customer feels like they’re a part of the brand, they buy more from that brand over competitors. So listen to them and use their feedback to inform what products you carry!
By employing a twist on Delphi method, you can keep the predictions consistently up to date while achieving a group consensus. Here’s how that might look:
- Step 1: You craft a survey asking customers to anonymously report what they feel about three different products you currently carry, giving them the ability to choose between extremely likely to buy, likely to buy on sale and not likely to buy. You also include an optional form question where they can suggest new products for you to carry.
- Step 2: You gather the results and craft a second survey. This one asks customers to agree or disagree with the results of the previous survey. If multiple people suggested similar product types you should carry on the previous survey, you add at least one and ask for feedback on it, giving them the ability to choose between extremely likely to buy, likely to buy on sale and not likely to buy. Again, you include an optional form question where they can suggest new products for you to carry.
- Step 3: You gather the results and craft a third survey along the same lines. If there was a clear consensus of opinion on products between the first and second surveys, you omit them from this survey.
You can repeat this indefinitely, changing the products you’re asking about as you gather consensus.
Determine your inventory forecasting period and stay on top of your reorder points
How far back should you look to forecast demand?
From seasonality to shifting needs, not all SKU’s reorder points will stay the same throughout the year. Habits change, holidays pass, customers adjust what channels they shop at, external factors—like construction—impact store traffic and, ultimately, you’re left with new variables impacting your data.
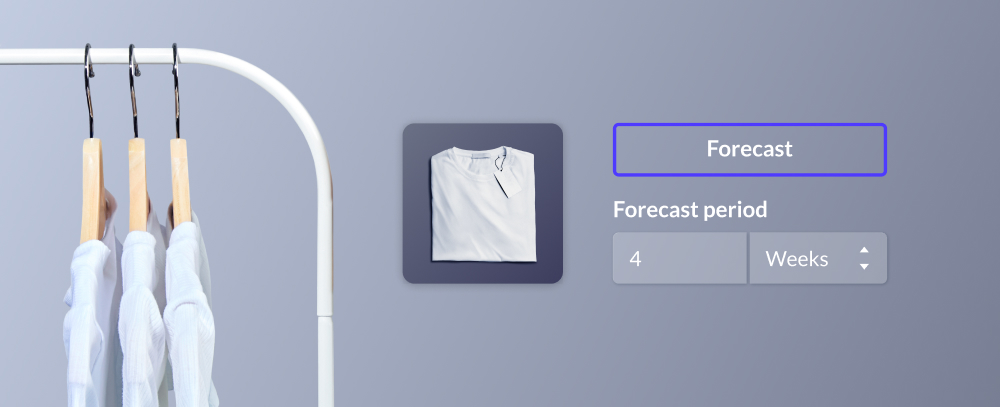
You may not be able to rely on sales data from last year to make completely accurate predictions all the time—but quantitative predictions based on sales from the last 30 to 90 days are usually viable if you need to narrow in for some reason. With Lightspeed Insights you can forecast for non-seasonal replenishment. Lightspeed gives merchants the ability to view suggested order quantities that consider past sales volumes and stockouts when deciding what to order. And you can view these at different levels: product, category or brand with a given timeline and forecast period.
If you’re currently seeing a lot of shifting demand and uncertainty, keep your forecast period long enough to get a proper picture of changing trends, but short enough that it keeps your current reality and economic conditions in focus.
Inventory forecasting tools
Not having to rely exclusively on your gut makes inventory forecasting a whole lot easier. Let’s explore how Lightspeed can help with your inventory forecasting.
Lightspeed gives retailers access to sales data in two ways: through the POS system’s built-in sales reports and, if you want to get even more granular, through reports from Lightspeed Insights tools.To illustrate how inventory forecasting software can help you predict demand, let’s go over how you could use a few of the tools found in either option.
Forecasting inventory with your point of sale
The first place to look for inventory forecasting is arguably the most obvious: your point of sale system. Your store managers should be able to easily pull sales data and set target stock levels and reorder points so that you’re never left with empty—or too full—shelves. If you’re working with a POS that makes inventory forecasting harder, it’s time to switch.
With Lightspeed Retail, you can set custom reorder points for any SKU. This simplifies how you maintain enough inventory to support demand in-store and online.
Reorder points are the stock level at which you need to order more inventory so you don’t run out. Ordering before this point means you’ll have too much on hand, and ordering after means you risk a stockout.
Whether you’ve used quantitative sales data or qualitative data, setting the amount of inventory of a specific SKU you want on-hand is the result of forecasting. To have an accurate reorder point, you need to predict how fast an item sells and how long it takes the shipment to arrive from the supplier.
You can crunch the numbers yourself—or your managers can—or you can use forecasting tools, like the forecast mode in Lightspeed Insights, to suggest reorder points for you.
As a bonus, it’s not just your business that’ll benefit from built-in inventory forecasting tools. Vendors appreciate it as well, as jewelry retailer LIMBO knows; they’re able to easily share results and forecasts with vendors, which helps everyone in the supply chain tighten up their processes. “They say we’re the most organized store they work with because we’re able to pinpoint exactly what’s selling, exactly what’s not selling,” says Anne Enriquez, owner of LIMBO.
How to use reorder points to keep the right inventory levels on hand
Let’s say you’ve run a sales report on a pair of insulated socks for the last 90 days, counting each month of sales totals separately for a more granular picture. In those reports, you saw that the socks were selling pretty steadily, with an average of 2.5 pairs sold a week. You know that it’s currently taking about 2 weeks for shipments from your supplier to arrive.
This means that:
- Your desired inventory level is 15 units
- Your desired reorder point is 5 units
You arrived at these numbers by making a quantitative prediction based on sales data. The desired inventory level of 15 means that you always have enough on hand to prevent selling out while you wait for new stock, while a reorder point of 5 means that the reorder point in your inventory will let you know that it’s time to reorder 10 more pairs of socks.
You may have already spotted the issue here—if demand fluctuates throughout the year, how can one set reorder point help you accurately respond to demand?
The answer is that it can’t; while reorder points are important, automated forecasting tools updating them for you is what makes them worth using. In Lightspeed, for example, when you go to place a purchase order, the system can examine your stock levels and recommend reorder quantities for you based on past out-of-stock periods when ordering. That means you don’t need to do the math; the platform does it for you.
Forecasting inventory demand with analytics tools
Knowing how much to order, and when, isn’t where inventory forecasting ends. If you’re ready to take it a step further, you’ll want to get a hold of advanced retail analytics tools, like Lightspeed Insights, which helps you dig even deeper into your data to enrich your predictions.
Let’s say you were looking to add a new product to your store, but without historical sales data, you don’t know how much to order or what expected sales revenue will be. In addition to qualitative data about how that product has performed for competitors, you could look at:
- Sales totals for the vendor’s other products: first things first—does the vendor you’re looking to work with perform well in your business? This is a chance to reevaluate your relationship as a whole. If there’s a pattern of under- or over performing, you’ll find it in comparative data analysis.
- Month over month performance for the product category as a whole: is it worth it to bring in a new product in this category? It may be that products from your chosen supplier generally do well, but sales in one particular category are declining or staying flat. That would mean inventory forecasting for this new product might not be optimistic unless you address why sales are down in the first place.
Or you might find that particular product category is doing exceptionally well lately—in which case, jackpot! Now you have a qualitative inventory forecasting data point that says your new product should perform well.
- Sales volume from the vendor you’re considering compared to another you work with: Say you’ve run some reports and found products from the vendor you’re considering seem to sell well. How do those numbers compare to other vendors? This data point could tell you if you need to pivot and consider bringing in a new product from someone else, or if you’re clear to go ahead with this vendor.
- Return percentage for similar products, or products by the same brand: high volumes of sales aren’t the only piece of the picture. If similar products, or goods from the brand you’re considering, are frequently returned, take that into consideration with your forecasting—are projected potentially high sales truly going to bring in enough revenue to justify that product? (And, for more to think about, should you be pruning those other products from your catalog?)
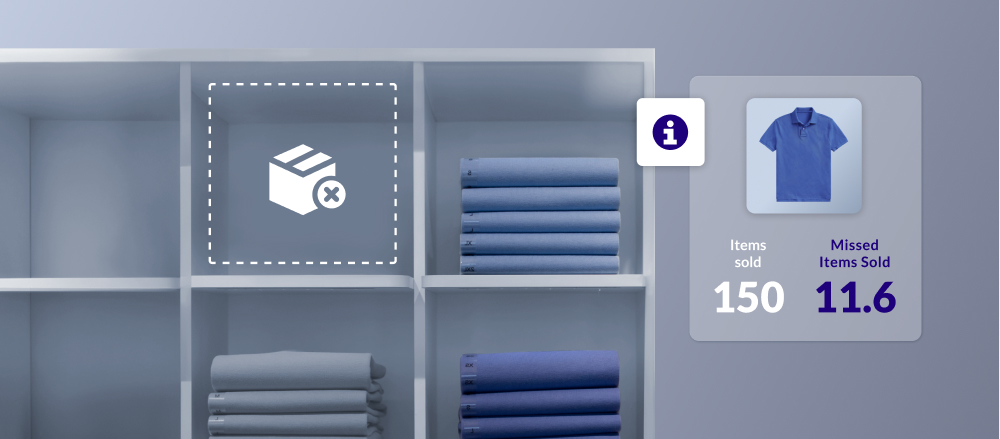
Conversely, if you find a lower than average return percentage on related products/brands, you can feel more confident that this product will please shoppers as well. - Missed Sales and estimated sold: take into account your past out-of-stock periods when ordering so you can proceed with a higher degree of accuracy and avoid missing sales. This helps to reduce the number of out-of-stock days and ensure you have the right amount of stock during busy periods.
Smart planning with inventory forecasting
Relying exclusively on your gut to forecast how much inventory to buy is risky, but ever since the pandemic hit, so is relying exclusively on previous sales data.
Start using both qualitative and quantitative information when forecasting demand for certain SKUs to assure that you’re making the most sound decision possible. Especially now, proper inventory forecasting is essential if you want to minimize your cost of goods sold (CoGS) and maximize profits.
See what Lightspeed Insights can do to future-proof your business.

News you care about. Tips you can use.
Everything your business needs to grow, delivered straight to your inbox.