
As a retailer your business will live or die based on how well you manage your inventory.
This is particularly true for growing and large retailers. For businesses with multiple locations or steady growth, knowing where to focus your attention is what keeps inventory costs down and revenue steady.
Enter the ABC inventory analysis.
Done right, ABC analysis changes how you approach inventory. It’s a way to ensure your time, budget and energy are directed toward what matters most.
- What is ABC inventory analysis?
- How does ABC analysis work?
- Benefits of ABC inventory management
- Steps to implement ABC analysis
- Challenges and limitations
- ABC analysis vs. other inventory management techniques
Inventory Spreadsheet Template
Download this free inventory spreadsheet to help you better manage your stock, purchases and sales.

What is ABC inventory analysis?
ABC analysis of inventory is a straightforward method that categorizes items based on their impact. It helps you zero in on high-value products, simplify purchasing decisions and optimize your supply chain without wasting resources.
How does ABC analysis work?
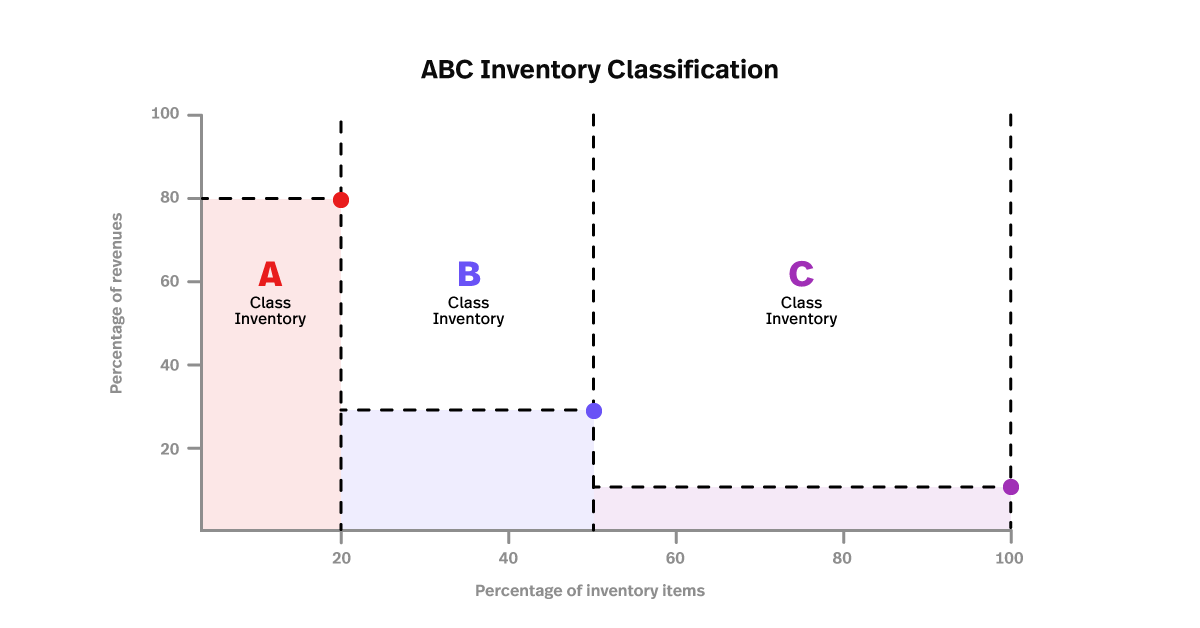
ABC analysis sorts inventory into three categories—A, B and C—based on their overall value to your business.
The goal is simple: focus on the inventory that generates the most revenue while reducing the time and resources spent on lower-value stock. It follows the Pareto Principle, where 20% of your inventory typically accounts for 80% of its total value.
Breaking it down starts with calculating the annual consumption value for each item. You multiply an item’s annual demand by its per-unit cost—that’s your number.
Annual Consumption Value=Annual Demand×Per-Unit Cost
Once you have those values, rank everything in descending order. The highest-value items naturally become your top priority.
- Class A items: These represent about 10-20% of your inventory but contribute roughly 70-80% of its value. They need tight control, frequent restocking andaccurate demand planning.
- Class B items: These fall in the middle—20-30% of inventory, contributing 15-25% of value. They require moderate oversight and occasional reviews.
- Class C items: These make up the bulk of inventory, around 50-70%, but contribute just 5-10% of value. They’re low-risk and can be managed with minimal effort.
Finally, cumulative percentages of both inventory volume and value are used to define the boundaries between A, B and C categories. The result? A clear structure for prioritizing your most valuable stock while streamlining management of everything else.
| Class | Inventory Percentage | Value Contribution | Management Strategy |
| A | 10-20% | 70-80% | Tight control, frequent restocking, accurate demand planning |
| B | 20-30% | 15-25% | Moderate oversight, occasional reviews |
| C | 50-70% | 5-10% | Low-risk, minimal effort management |
Benefits of ABC inventory management
Better focus on high-value items
ABC inventory management keeps your attention on what matters most—your high-value inventory. Class A items, which drive the majority of your revenue, deserve priority when it comes to tasks like forecasting, restocking and supplier negotiations. By zeroing in on these, youreduce stockouts where it counts and avoid wasting time on items that contribute less.
Reduced holding costs and improved cash flow
Class C items might take up the bulk of your storage space but don’t generate much return. Managing them with leaner strategies—like bulk ordering or minimal oversight—frees up valuable resources. This approach helps you reduce carrying costs, improveinventory turnover and free up cash flow for growth.
Optimized purchasing and stocking strategies
ABC analysis breaks down purchasing strategies by category, so each class gets exactly the attention it needs. Class A items might call for frequent reorders or close collaboration with suppliers. On the other hand, Class C items could be ordered in bulk or handled with automated processes. This segmentation ensures your stock levels match demand without overordering or understocking.
Improved decision-making and resource allocation
Breaking inventory into classes makes it easier to allocate resources effectively. Class A items might need more oversight from managers, while Class B and C items can be managed with fewer hands-on processes. This lets you focus your time and budget where they’ll have the biggest impact, cutting inefficiencies along the way.
Examples of applications in different sectors
In retail, ABC analysis ensures high-margin products stay in stock, while seasonal or low-demand items are ordered strategically. In manufacturing, it highlights critical materials for uninterrupted production and deprioritizes non-essential components. No matter the industry, the framework adapts to the unique demands of your supply chain.
Steps to implement ABC analysis
Step 1: Data collection
Start with yourinventory data—it’s the foundation of ABC analysis. You’ll need details like turnover rates, sales frequency and each item’s total value. Total value is easy to calculate: multiply an item’s annual demand by its unit cost. The more accurate and current your data is, the better your results will be.
Step 2: Conducting ABC classification
Once you’ve gathered the numbers, it’s time to classify your inventory. Rank your items by total value, starting with the highest. Then, calculate cumulative percentages for both the number of items and their total value. Use those percentages to divide your inventory into Class A, B and C categories. Class A items are the high-value, low-quantity products that need the most attention. Class B follows with moderate value and quantity, while Class C includes low-value items that make up the bulk of your stock.
Step 3: Setting control policies based on classification
Each category needs its own management plan. For Class A items, focus on frequent restocking, tighter inventory controls and strong supplier relationships to avoid stockouts. Class B items require a balanced approach—regular monitoring with less intensive oversight. Class C items? They’re often best handled with bulk orders or automated processes to save time and reduce effort.
Step 4: Continuous monitoring and adjustments
Inventory is never static. Demand changes, new products come in and priorities shift. Regularly review your ABC classifications to keep them relevant. Reassess after major changes like product launches or seasonal demand spikes. Adjust your strategies as needed to keep your inventory management system efficient and aligned with your business goals.
Challenges and limitations with ABC inventory analysis
Difficulties in collecting accurate data
Precise data is the backbone of ABC analysis. Sales figures, costs and demand all need to be accurate—any errors or outdated records can throw off classifications entirely. When the data isn’t reliable, decisions about inventory can lead to wasted spending or poor management of high-priority items.
Static nature of analysis, requiring frequent updates
ABC classifications aren’t set in stone. Market trends shift, customer habits change, and product relevance evolves—all requiring regular updates to keep your analysis useful. Without those updates, the framework becomes outdated fast, leaving you with inefficiencies and missed opportunities to adjust inventory strategies.
Misclassifying items or over-reliance on value
Relying too much on monetary value can lead to blind spots. Low-cost items that are operationally critical might slip through the cracks, while high-value products with less importance to daily operations may get undue attention. Seasonal demand or irregular purchasing patterns can also cause misclassifications, resulting in overstocking, stockouts or wasted resources.
Resource intensity for implementation
ABC analysis takes time and effort, especially for businesses managing large inventories. Collecting data, conducting classifications and keeping things updated can be a heavy lift for smaller teams. When resources are stretched thin, it’s easy for regular reviews to fall by the wayside—diminishing the overall impact of the analysis.
While ABC analysis can be a powerful tool, it demands attention and upkeep to ensure it works as intended. A consistent, focused approach is the key to avoiding these common challenges.
ABC analysis vs. other inventory management techniques
| Comparison | Key Differences |
| ABC Analysis vs. Just-In-Time (JIT) | JIT focuses on minimizing inventory by ordering only when needed, reducing holding costs but requiring accurate forecasting and reliable suppliers. ABC analysis prioritizes inventory by value, offering flexibility in unpredictable demand or supply chain disruptions. |
| ABC Analysis vs. Economic Order Quantity (EOQ) | EOQ optimizes order size to balance holding and ordering costs, assuming steady demand but treating all inventory equally. ABC analysis ensures high-value items (Class A) receive prioritized attention, complementing EOQ for a refined strategy. |
| ABC Analysis vs. Perpetual Inventory Systems | Perpetual inventory systems track stock in real time, providing continuous updates on stock levels but not prioritizing items. ABC analysis highlights high-value inventory, enhancing resource allocation and strategic decision-making. |
ABC analysis vs. Just-In-Time (JIT)
Just-In-Time (JIT) is all about keeping inventory lean by ordering stock only when it’s needed. It’s great for cutting holding costs and streamlining operations, but it depends on accurate demand forecasting and reliable suppliers—which isn’t always realistic. ABC analysis takes a different angle. Instead of focusing on timing, it prioritizes inventory by value. If your business deals with unpredictable demand or supply chain disruptions, ABC analysis might give you a more flexible way to manage stock.
ABC analysis vs. Economic Order Quantity (EOQ)
EOQ helps determine the ideal order size to balance holding and ordering costs. It works well for businesses with steady demand and consistent replenishment cycles. But EOQ treats all inventory the same, which can cause high-value items to be overlooked. ABC analysis fills that gap. By prioritizing Class A items, it ensures your most important products receive the attention they deserve while working alongside EOQ to refine your strategy.
ABC analysis vs. perpetual inventory systems
Perpetual inventory systems track stock levels in real time, giving you up-to-the-minute data on inventory movement. While that level of accuracy is valuable, it doesn’t tell you which items matter most. ABC analysis brings clarity to the data by focusing on profitability, helping you allocate resources to high-value stock. Together, they create a more strategic approach to inventory management.
Every method has a purpose, but ABC analysis stands out for its ability to focus on what drives business growth. Pairing it with other inventory management techniques can help you create a smarter, more efficient system.
Bottom line
ABC analysis of inventory is a straightforward way for retailers to manage operations with more focus and control. By sorting stock into Class A, B and C based on value, you can zero in on your most important products, streamline day-to-day management and make better use of your resources. It’s a method that cuts holding costs, improves cash flow and keeps your inventory aligned with actual demand.
But the benefits don’t stop there. ABC analysis simplifies decision-making by showing exactly where to spend your energy—whether it’s supplier negotiations or tightening restocking processes. It’s a practical way to run a more efficient operation while staying ready to scale.
Talk to an expert to see how this approach can reshape your inventory management and help grow your business.
FAQs
What is the ABC analysis in simple words?
ABC analysis is a way to organize inventory by dividing it into three categories—A, B and C—based on how valuable each item is to your business. Class A items are the most valuable and make up the biggest share of revenue, Class B items are moderately important and Class C items are lower-value products that don’t need much attention. The idea is simple: focus your efforts where they’ll make the most difference.
What is the main objective of ABC analysis?
The main goal of ABC analysis is to make inventory management more efficient by focusing on your most important products. It helps you spend your time, money and energy on high-value items that drive revenue while streamlining how you handle less critical stock. The result is better cost control, smarter decisions and a more efficient operation overall.

News you care about. Tips you can use.
Everything your business needs to grow, delivered straight to your inbox.