
The right ingredients to running a successful restaurant aren’t just on your menu—they can also be found by tracking the right metrics, aka your key performance indicators (KPIs).
Restaurant KPIs are something that every owner and or manager should keep an eye on. Identifying and monitoring the right metrics enables you to make smarter business decisions that ultimately lead to more streamlined operations and a higher bottom line.
In many cases, tracking your restaurant metrics can alert you to potential problems before they become bigger issues.
In this article, we’ll shed light on some of the most important restaurant KPIs to keep an eye on. Fromrestaurant profit margins to customer satisfaction and employee productivity, we’ll break down each metric, their significance and how to effectively track them.
- Revenue and profitability metrics
- Operational and performance metrics
- Customer and guest metrics
- Technology and digital metrics
- Comparing your metrics against competitors
Is your food costing accurate?
This is your content
Revenue and profitability metrics
Tracking revenue and profitability metrics provide a clear snapshot of your restaurant’s financial health, indicating its ability to generate income and manage costs. These metrics help identify profit-drivers and expense leaks, paving the way for strategic decision-making and sustainable growth.
1. Gross profit margin
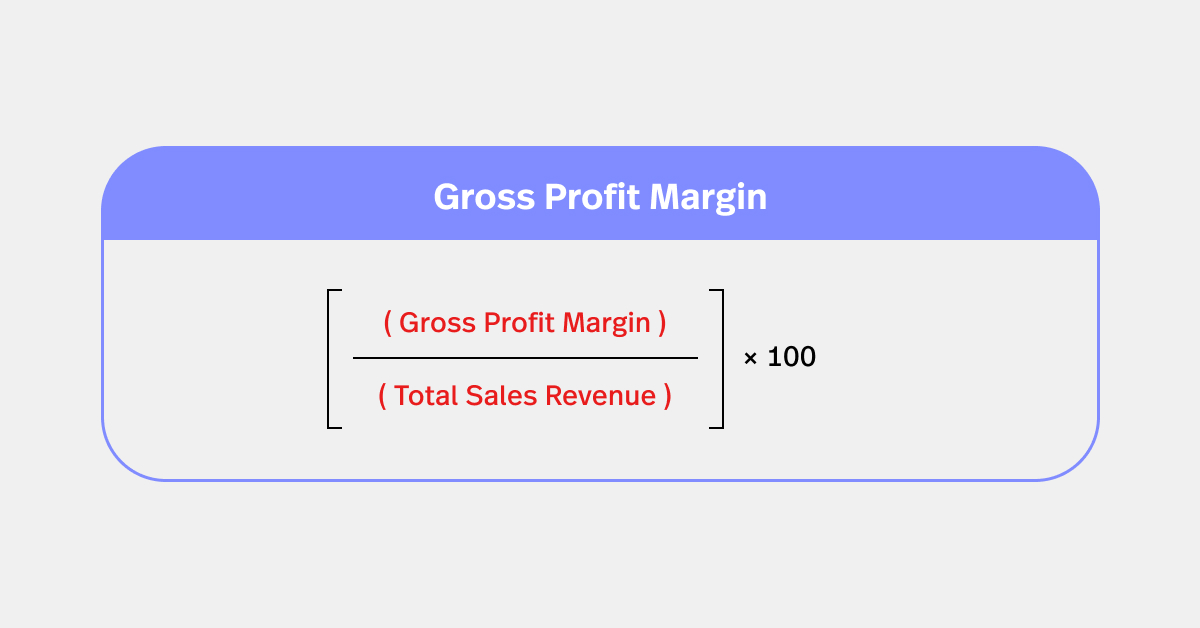
Gross profit margin is the percentage of total sales revenue that your restaurant retains after direct costs of producing the goods or services (like food and labor costs). A higher gross profit margin indicates a more financially efficient operation.
How to calculate gross profit margin
The formula for gross profit margin is: Gross Profit Margin = (Gross Profit / Total Sales Revenue) * 100
This means you need to first subtract the Cost of Goods Sold (COGS) from your total sales revenue. This will give you the Gross Profit. Next, divide this Gross Profit by the Total Sales Revenue.
2. Net profit margin
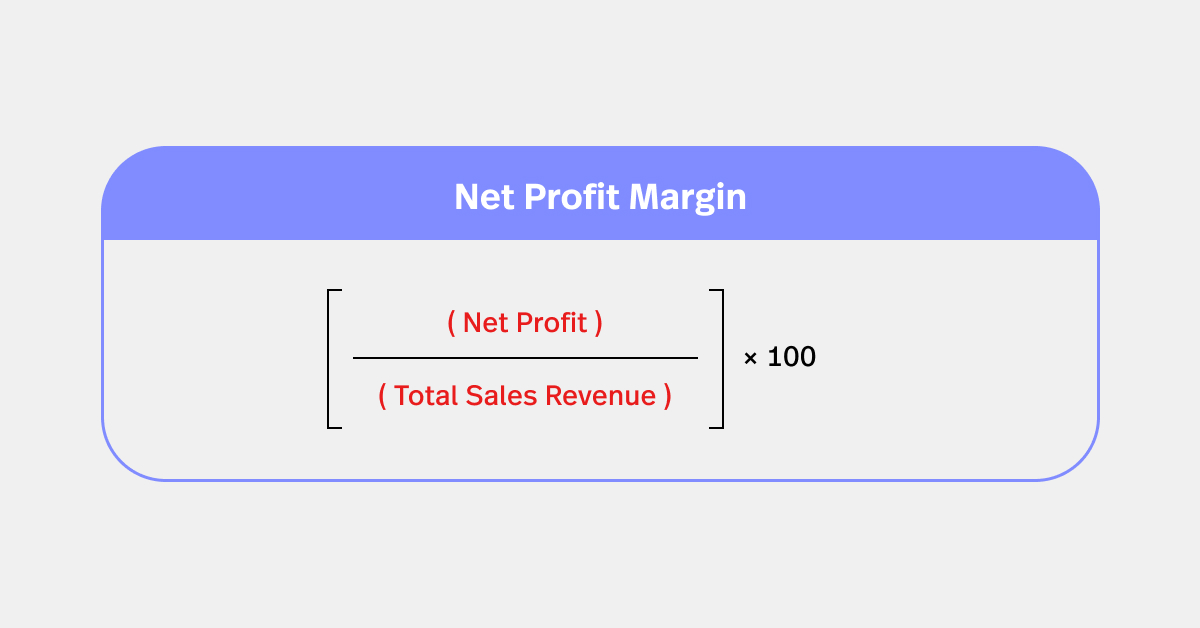
Your restaurant’s net profit margin shows how much of each dollar earned is converted into profit after all expenses. This restaurant KPI incorporates not just the cost of food and labor, but all operational costs—making it an essential tool for understanding your true bottom line.
How to calculate net profit margin
The formula for net profit margin is: Net Profit Margin = (Net Profit / Total Sales Revenue) * 100
Subtract Total Expenses (which includes COGS, labor costs, overhead costs and other operating expenses) from Total Sales Revenue. This gives you the Net Profit. Then, follow the formula above to find your net profit margin.
3. Average covers
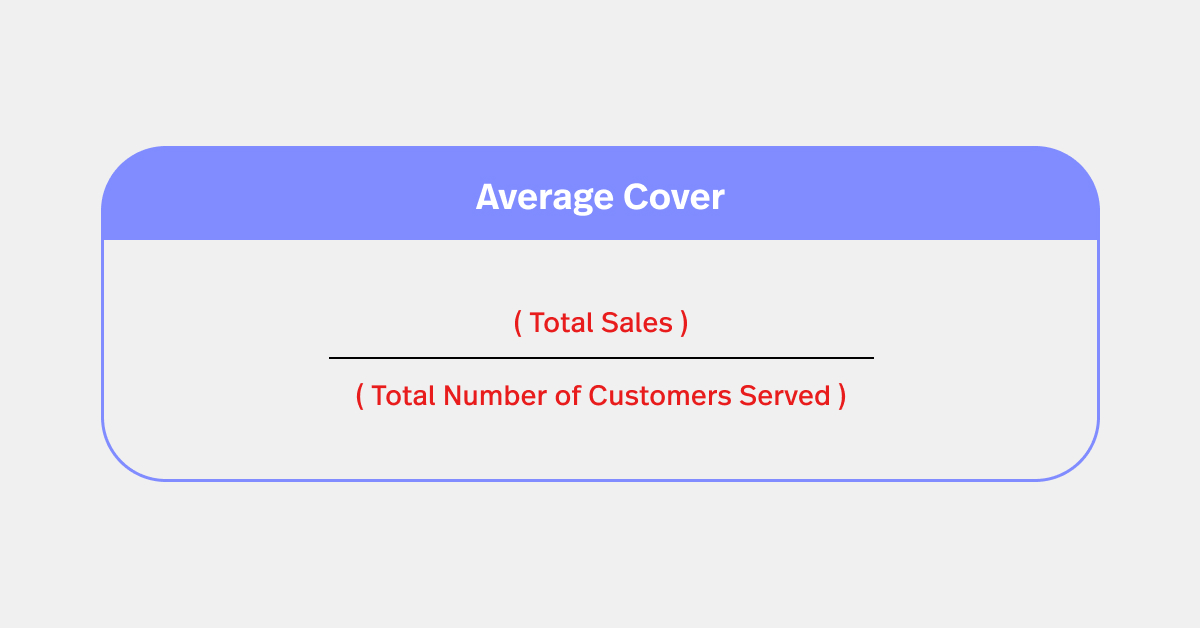
Average covers represent the average number of customers served per day or per service (like breakfast, lunch, or dinner). Tracking your covers enables you to identify traffic trends and demand patterns. That way, you can staff your restaurant and manage your inventory in a way that maximizes service quality and profitability.
How to calculate average covers
The formula to use is: Average Cover = Total Sales / Total Number of Customers Served
By dividing your total sales by the total number of customers served, you gain insight into spending patterns and can better strategize menu pricing, promotional activities and upselling techniques to boost revenue.
If you’re using Lightspeed Restaurant, you can automatically get your covers data using our Advanced Insights capabilities.
The Sales > Covers report shows your cover data to specific time periods, so you can get an idea of the average party sizes at your restaurant.
You can also check out the Servers > Covers report, which can help you see how your employees’ performance ranks across shifts, positions and menu category types based on the average amount an employee has sold per cover.
4. Cost of goods sold (COGS)
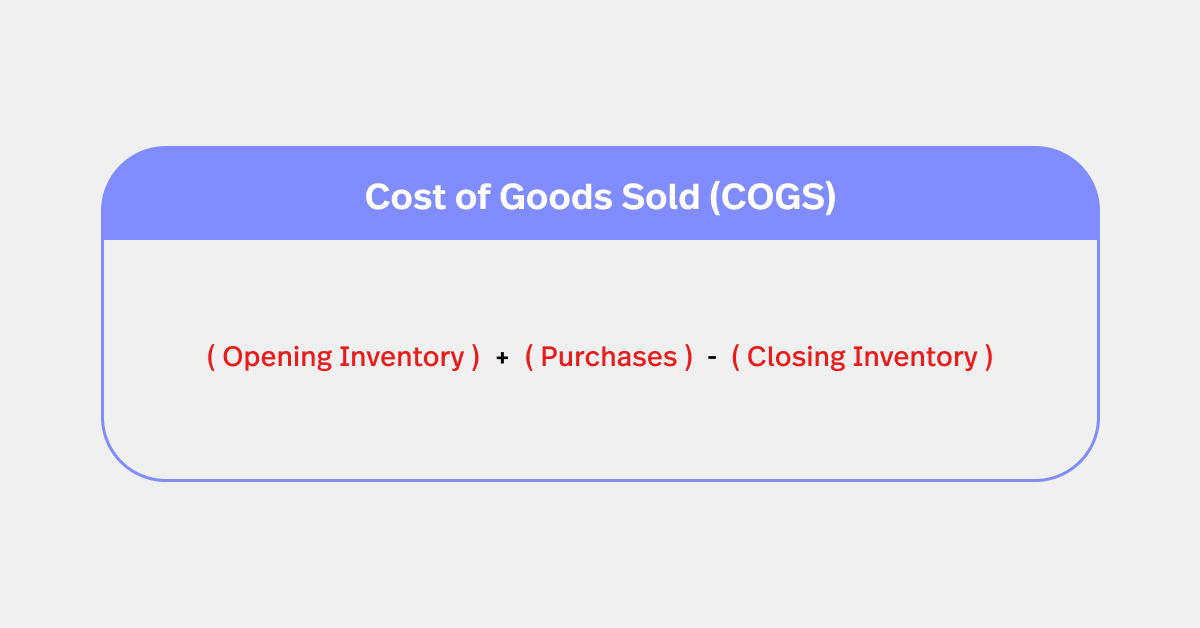
COGS would be the direct costs associated with producing the goods sold by a restaurant—typically, food and beverage costs. Keeping an eye on COGS helps you manage restaurant inventory efficiently and price menu items profitably.
How to calculate COGS
Calculating the Cost of Goods Sold (COGS) for a restaurant can be done with the following formula: COGS = Opening Inventory + Purchases – Closing Inventory
Here’s a breakdown of the terms:
- Opening Inventory: The value of your stock (food and beverage) at the beginning of the accounting period.
- Purchases: All additional stock bought during this period.
- Closing Inventory: The value of the stock that remains unsold at the end of the accounting period.
5. Food cost percentage
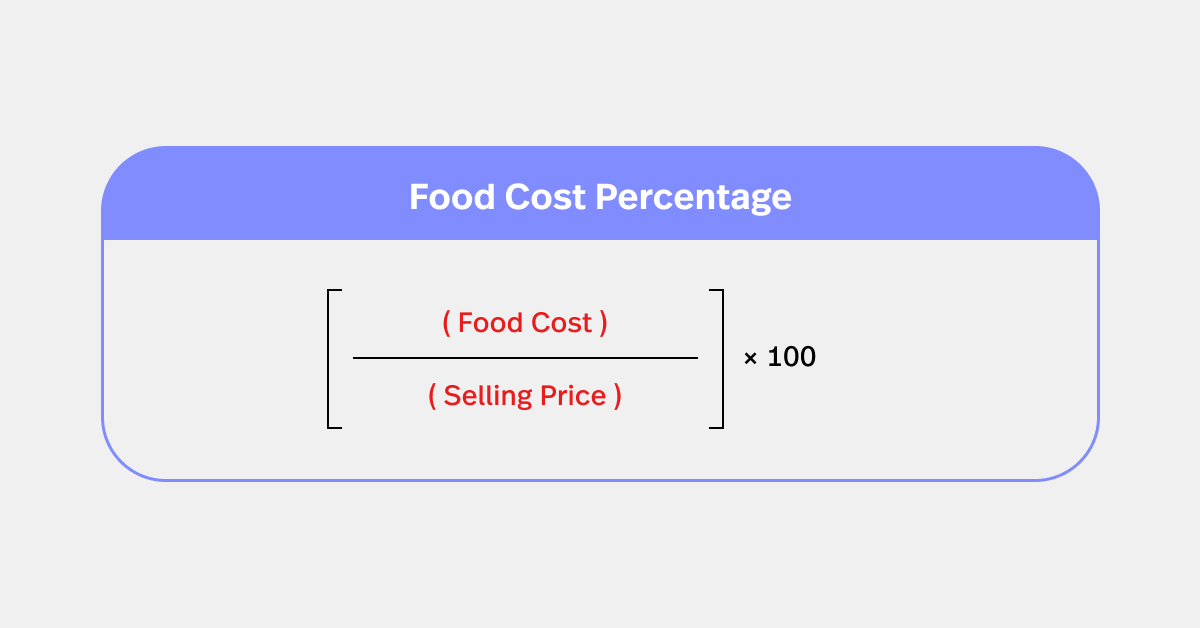
Another key profitability indicator, food cost percentage represents the portion of total sales revenue spent on food ingredients. If you’re looking to assess the cost-effectiveness of your menu items and keep your pricing strategy in check, this is a key metric to monitor.
How to calculate food cost percentage
The formula is: Food Cost Percentage = (Food Cost / Selling Price) * 100
For example, if a dish costs $5 to make and is sold for $20, the Food Cost Percentage would be (5 / 20) * 100 = 25%. This percentage helps you determine if a dish is priced appropriately considering the cost of the ingredients.
6. Cash flow
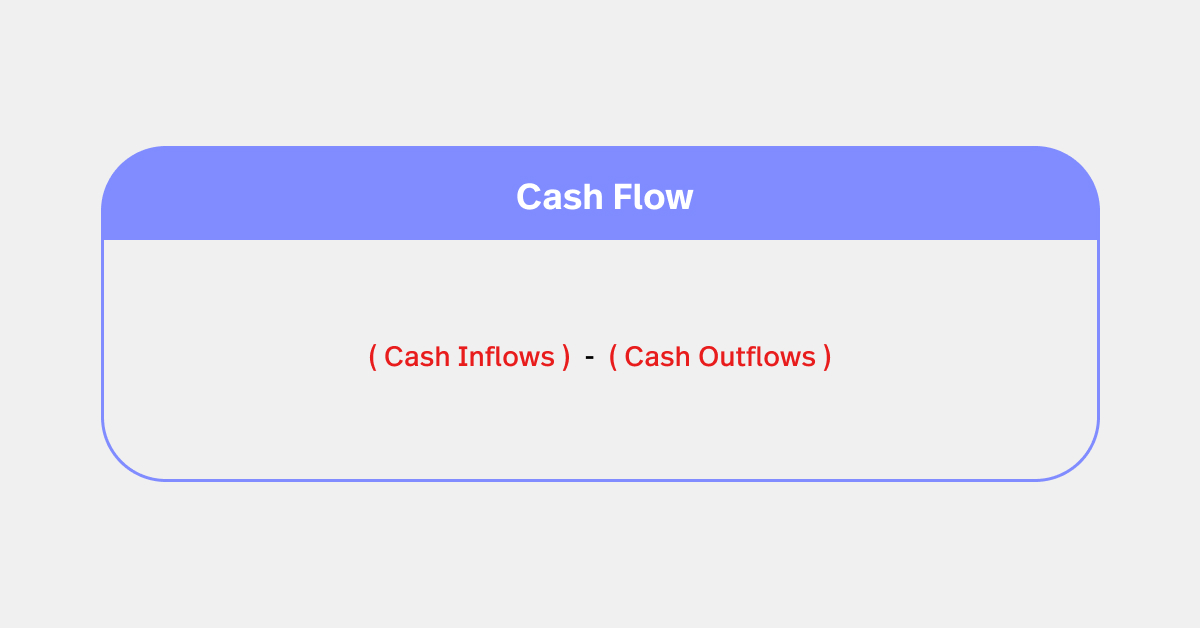
Cash flow is the net amount of cash and cash-equivalents moving in and out of your restaurant business. This restaurant KPI is crucial for assessing your business’ liquidity, solvency and overall financial health.
How to calculate cash flow
The general formula for cash flow is Cash Flow = Cash Inflows – Cash Outflows
In other words, it’s money in minus money out. If the result is positive, your business has a positive cash flow, which means more cash is coming into the business than going out. If it’s negative, the business has a negative cash flow, indicating that more cash is going out than coming in.
That being said, cash flow is not the same as profitability. A profitable business can still struggle if their cash flow is negative due to timing differences between inflows and outflows. That’s why it’s so crucial to monitor this restaurant metric.
7. Prime costs
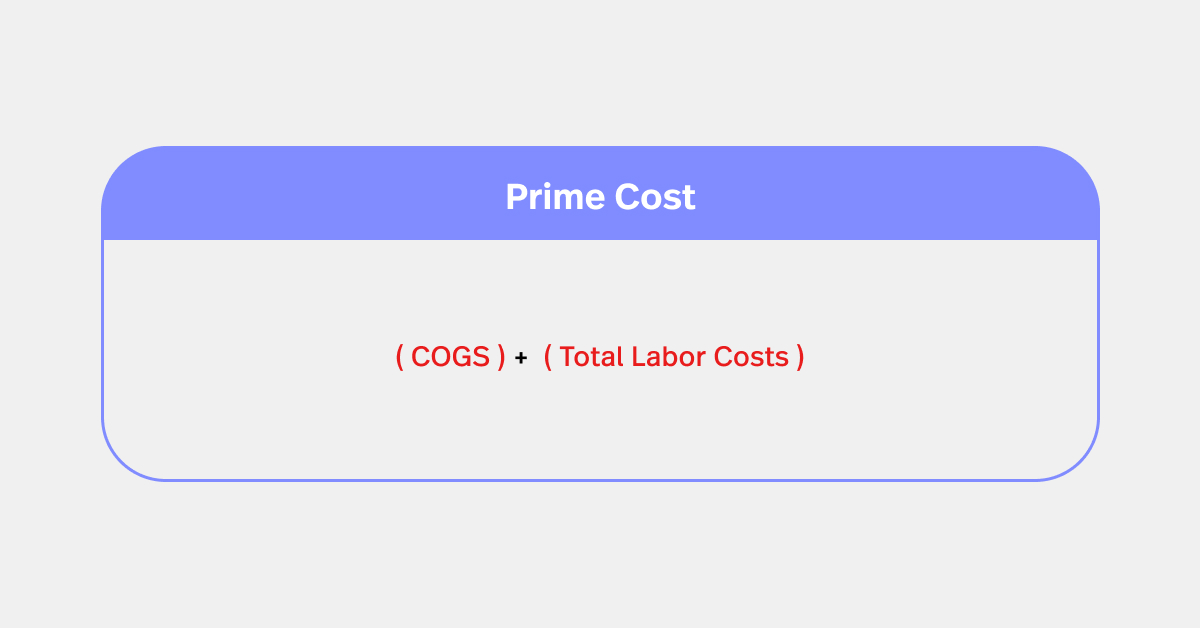
Prime costs encapsulate the two most significant expenses for a restaurant: the cost of goods sold (COGS) and labor costs. Closely monitoring your prime costs allows you to manage goods and labor more effectively, so you can ensure that you become (and stay) profitable.
How to calculate prime costs
Calculating Prime Costs involves adding up two major expense categories: the Cost of Goods Sold (COGS) and Total Labor Costs.
Here’s the formula: Prime Cost = COGS + Total Labor Costs
COGS includes the costs of all the ingredients used in preparing the food and beverages sold. Total Labor Costs include all costs related to your employees, such as wages, benefits and payroll taxes.
8. Average check size
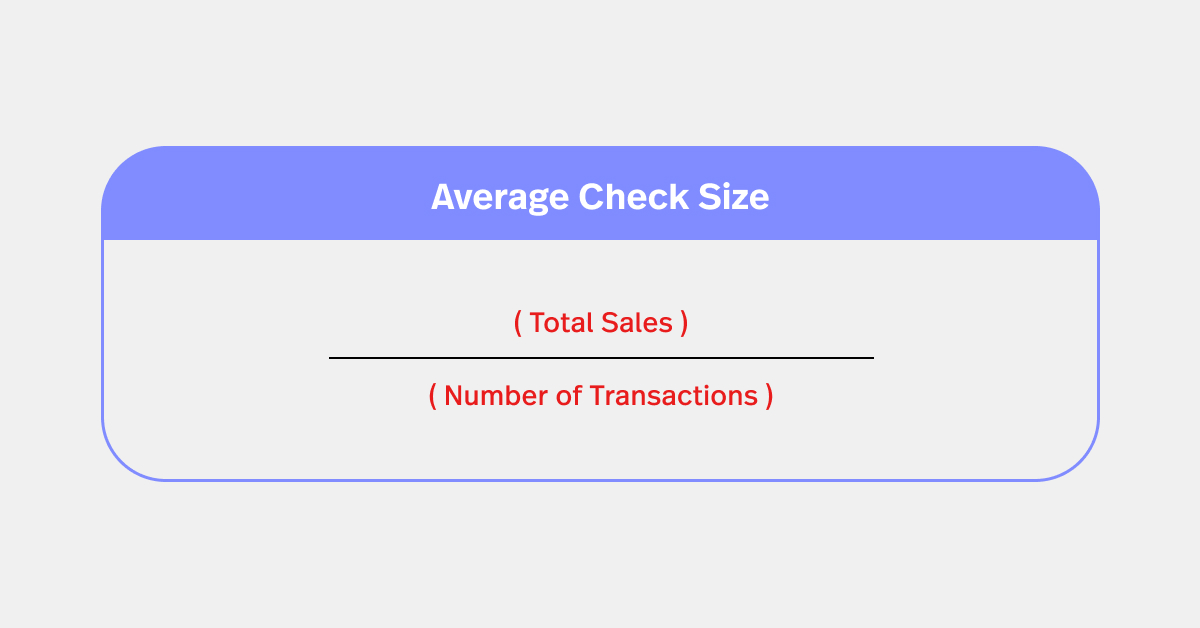
Also known as average ticket size, the average check size measures the average amount spent by customers on each transaction at your establishment. This restaurant metric provides insight into customer spending behavior and menu pricing effectiveness. By analyzing and optimizing the average check size, you can strategically implement upselling or cross-selling techniques to drive more revenue per customer.
How to calculate average check size
Calculating the Average Check Size is pretty straightforward.
Here’s the formula: Average Check Size = Total Sales / Number of Transactions
In this equation, Total Sales refers to the total revenue your restaurant has generated in a specific period, while the number of Transactions is the total number of bills issued to customers during that same period.
9. Break-even point
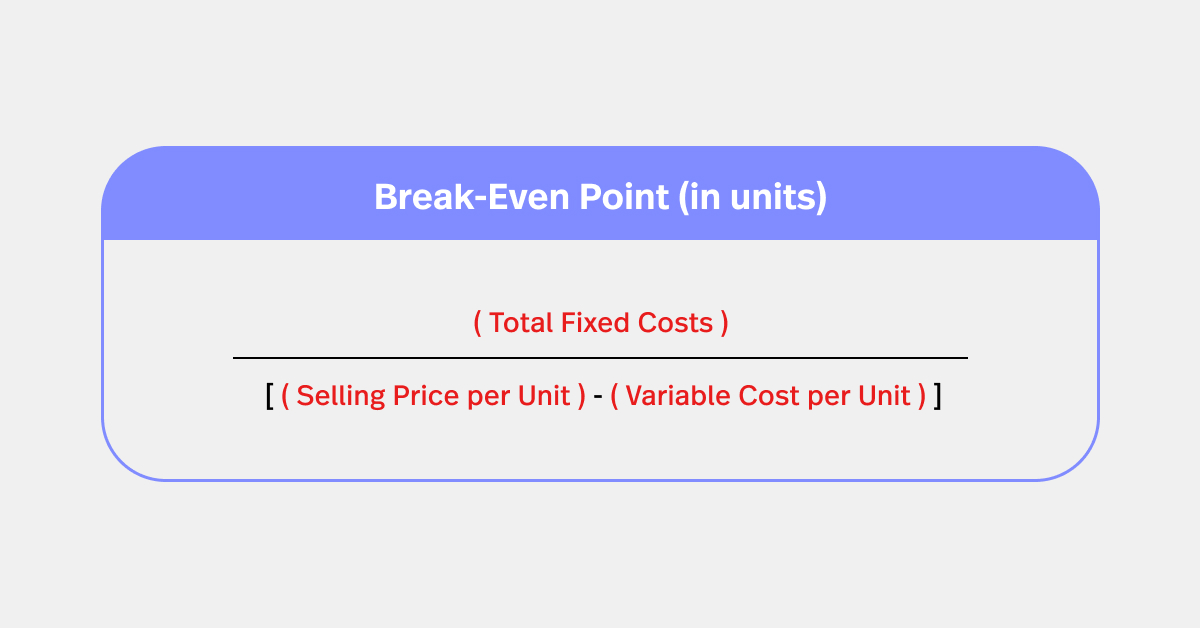
The break-even point is a critical financial metric indicating the minimum amount of revenue your restaurant needs to cover its total costs—both fixed and variable. It offers a clear target for financial sustainability, informing restaurateurs of how much they need to sell to start making a profit.
How to calculate break-even point
Here’s the formula for calculating the break-even point:
Break-Even Point (in units) = Total Fixed Costs / (Selling Price per Unit – Variable Cost per Unit)
Let’s say you own a restaurant, and you’ve calculated the following costs:
- Total Fixed Costs per month (like rent, insurance, salaries): $10,000
- Average Selling Price per meal: $20
- Average Variable Cost per meal (like food ingredients, utilities): $5
So, in this case:
Break-Even Point = $10,000 / ($20 – $5) = 666.67 meals
This means you need to sell approximately 667 meals in a month to break even. Any meals sold beyond this number would generate a profit.
Operational and performance metrics
The best restaurants are the ones that run like a well-oiled machine, and achieving that entails monitoring the right operational metrics. Restaurant KPIs like RevPASH, table turnover, food waste, etc. can show you how efficient you are with your time and resources. This, in turn, will help you streamline your restaurant operations.
So, let’s take a closer look at these operational and performance metrics and how you can improve.
10. Revenue per available seat hour (RevPASH)
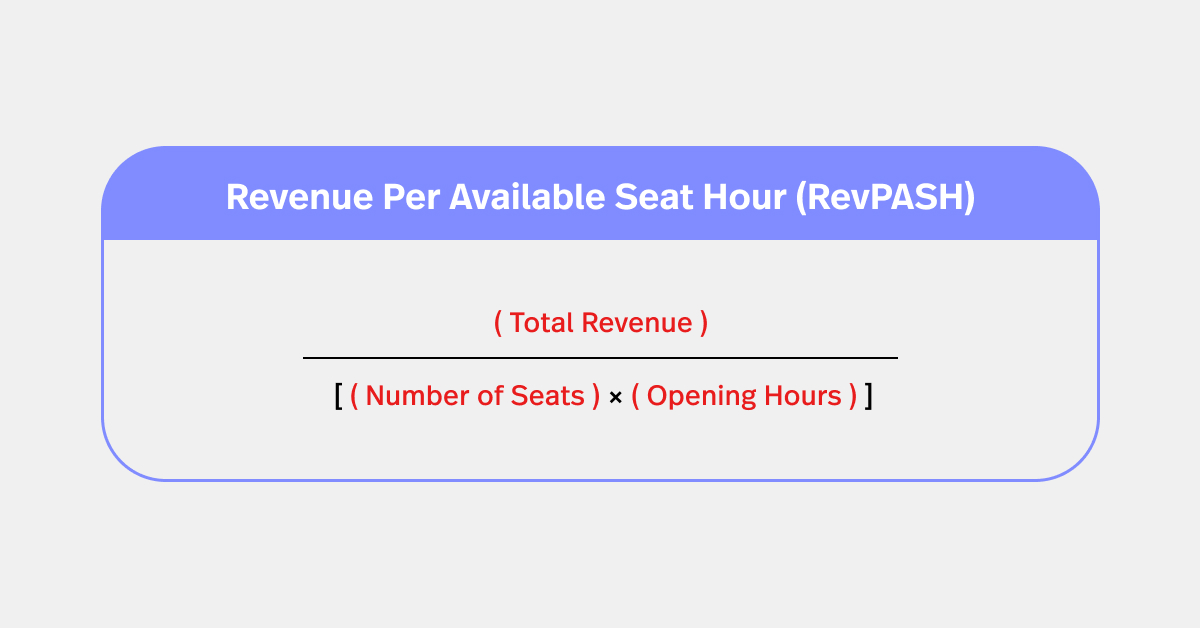
RevPASH measures the revenue generated for each seat in your establishment per hour. Tracking RevPASH makes it easy to understand your efficiency in turning tables and optimizing seat utilization, ultimately helping you maximize sales, improve service delivery and enhance customer experience.
How to calculate RevPASH
Revenue Per Available Seat Hour is calculated using the following formula: RevPASH = Total Revenue / (Number of Seats x Opening Hours)
Here’s what each component means:
- Total Revenue refers to the total sales your restaurant has generated in a specific period.
- Number of Seats is the total seating capacity of your restaurant.
- Opening Hours would be to the total number of hours your restaurant was open and serving customers in the same period.
Here’s an example: suppose your total revenue for a day was $20,000, your restaurant has 50 seats, and it was open for 10 hours, then: RevPASH = $20,000 / (50 seats x 10 hours) = $40
This means that each seat in your restaurant generated an average of $40 per hour on that day.
11. Turn time or table turnover
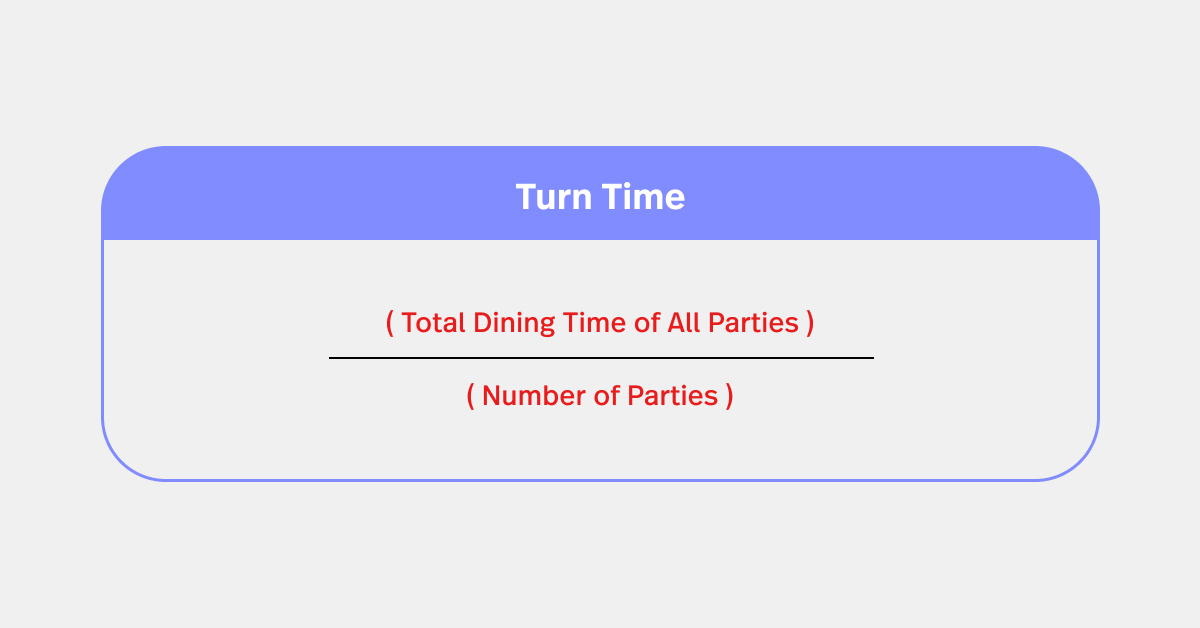
Turn time, also known as table turnover, measures the average amount of time a customer spends at a table from the moment they’re seated until they leave.
This KPI is a must for understanding how your restaurant manages its seating capacity.Turn time also impacts the number of covers served and how much revenue you generate.
How to calculate table turnover
The formula for table turnover or turn time is:
Turn Time = Total Dining Time of All Parties / Number of Parties
For instance, if over the course of an evening you had 20 parties dine at your restaurant and the total combined dining time was 40 hours, then:
Turn Time = 40 hours / 20 parties = 2 hours
This means, on average, each table is turned over every 2 hours.
12. Inventory turnover ratio
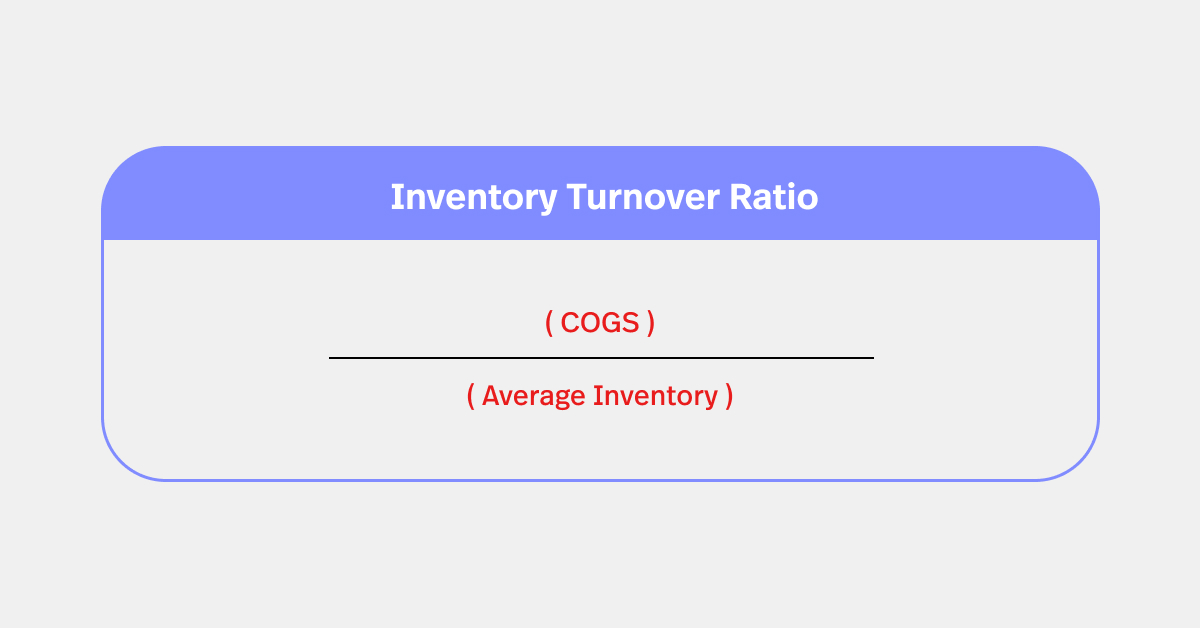
Inventory turnover refers to the number of times inventory is sold or used over a given period. A high turnover can indicate solid menu engineering and waste control, Meanwhile, if your turnover is low, it could mean facing overstocking or issues.
How to calculate inventory turnover ratio
You need two pieces of information to calculate your restaurant’s inventory turnover ratio: the Cost of Goods Sold (COGS) and the Average Inventory value.
Here’s the formula: Inventory Turnover Ratio = COGS / Average Inventory
For instance, if your COGS for a month was $20,000 and your average inventory value for that month was $5,000, then: Inventory Turnover Ratio = $20,000 / $5,000 = 4
This means you sold and replaced your inventory four times during that month. The higher the ratio, the more frequently you’re selling through your inventory, which is generally positive as it indicates fresher ingredients and lower holding costs.
Just note that if the ratio is too high, you may be at risk of running out of items and losing sales, so it’s all about finding the right balance for your specific restaurant.
13. Total sales by server
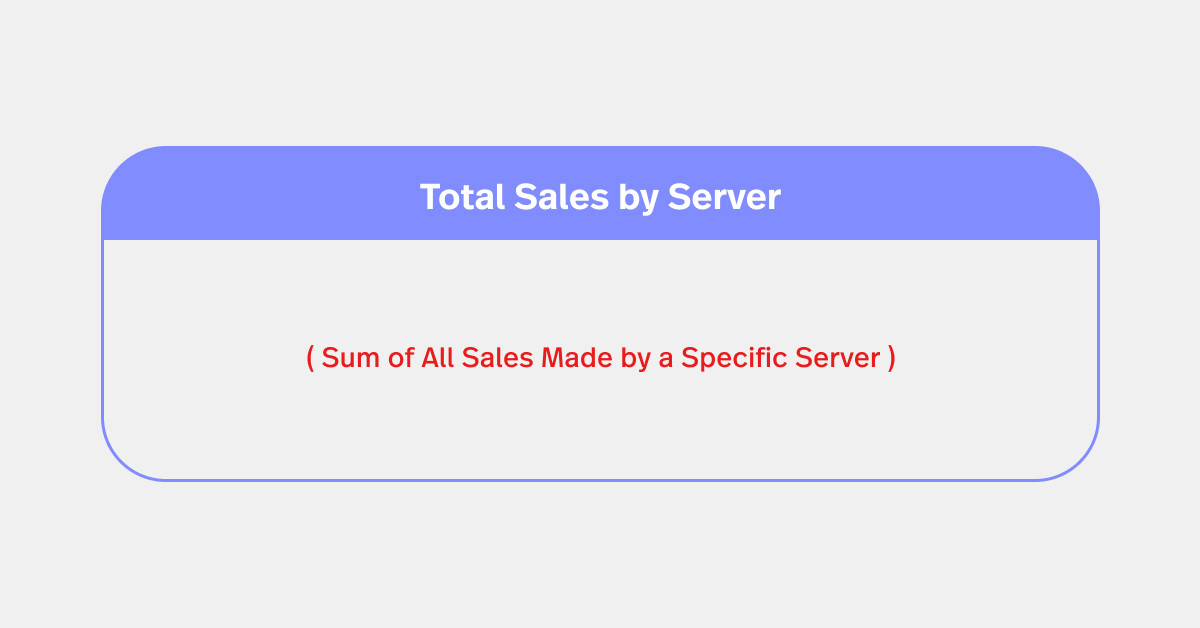
This restaurant KPI tracks the total revenue generated by each server in your restaurant. Tracking sales by server makes it easy to spot top performers. It also helps you identify additional training needs.
When you understand the sales abilities of each server, you and your managers can better assign shifts, balance workload and design incentive schemes to motivate staff and maximize sales.
How to calculate total sales by server
Like the other metrics in this guide, most POS systems can track this for you. However, if you need to calculate it manually, you can use the formula:
Total Sales by Server = Sum of All Sales Made by a Specific Server
For instance, if Server A worked 3 shifts in a week, and they made $500 in sales in the first shift, $600 in the second and $700 in the third, then: Total Sales by Server A = $500 + $600 + $700 = $1800
This means Server A generated $1800 in sales for that week. By comparing this to the sales made by other servers, you can identify who your top performers are, as well as who may need extra employee training.
If you’re looking for better ways to gain insights into the performance of your servers, you can use a solution like Lightspeed Restaurant, which offers several server-centric reports that you can filter and compare.
A commonly used report is the Checks report, which sheds light on employees performance across shifts, positions, and menu category types based on the average amount an employee has sold per check.
You can even filter the report by shift, menu item category, or position and drill down on specific restaurant metrics.
14. Food waste
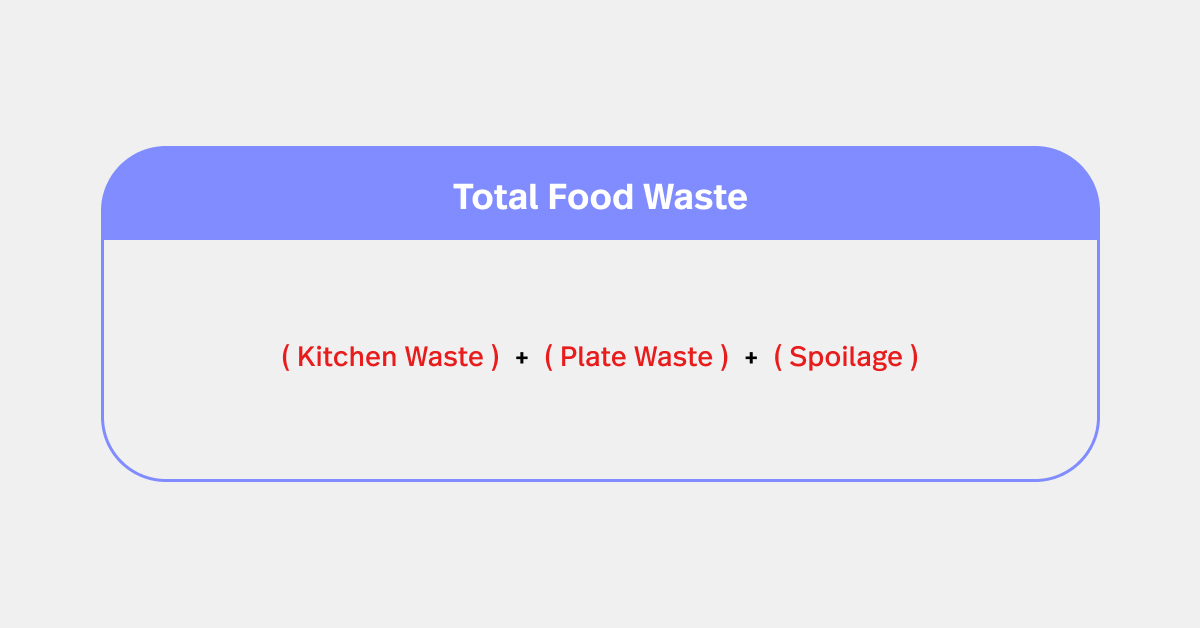
Restaurant food waste tells you the amount of food that’s purchased but ends up not being consumed by customers. This can be due to spoilage, over-preparation, or plate waste.
How to calculate food waste
Calculating food waste in a restaurant can be a bit tricky, as it requires tracking various elements from kitchen waste to plate waste. You’ll need to consider the following factors:
- Kitchen waste
- Plate waste
- Spoilage
Once you’ve tracked these elements over a certain period, you can add them together to get your total food waste:
Total Food Waste = Kitchen Waste + Plate Waste + Spoilage
This should give you a clear starting point to determine how you can reduce waste in your restaurant. Doing so not only saves money but is also an important part of running a sustainable restaurant.
Customer and guest metrics
Aside from tracking your financial and operational metrics, you’ll also want to look into customer-centric KPIs for your restaurant. That way, you can understand your restaurant’s performance from your patrons’ perspective.
15. Foot traffic or guest count
Want an easy way to measure your restaurant’s popularity? Then your foot traffic (or guest count) is a good KPI to start with.
This KPI also helps you identify busy times, so you can schedule the right staff at the most optimal periods. Plus, your foot traffic or guest count offers insights into the effectiveness of marketing campaigns and seasonal trends, so you can plan and forecast accordingly.
How to calculate foot traffic or guest count
In some cases, your POS can track this for you. You can also consider people counters to track your foot traffic. However, if you’re doing it manually, you or your staff will need to count the number of customers who come into your restaurant over a specific period (a day, a week, a month, etc.).
For example, if you had 75 customers come in on Monday, 85 on Tuesday and 90 on Wednesday, your foot traffic for those three days would be:
Foot Traffic = 75 (Monday) + 85 (Tuesday) + 90 (Wednesday) = 250 customers
From there, you can choose to compare it with previous time periods (such as the same period last year) and get an indication of whether your traffic is improving or not.
16. Customer satisfaction score (CSAT)
CSAT isn’t a restaurant-specific metric, but it’s a good KPI to track nonetheless. That’s because it tells you where your customers are at in terms of satisfaction with your restaurant.
How to calculate CSAT
To calculate the Customer Satisfaction Score (CSAT), follow these steps:
- Survey your customers, asking them to rate their satisfaction with your restaurant on a scale. Typically, this is a scale from 1 to 5 or 1 to 10, with higher scores indicating greater satisfaction.
- Collect the scores from all the respondents.
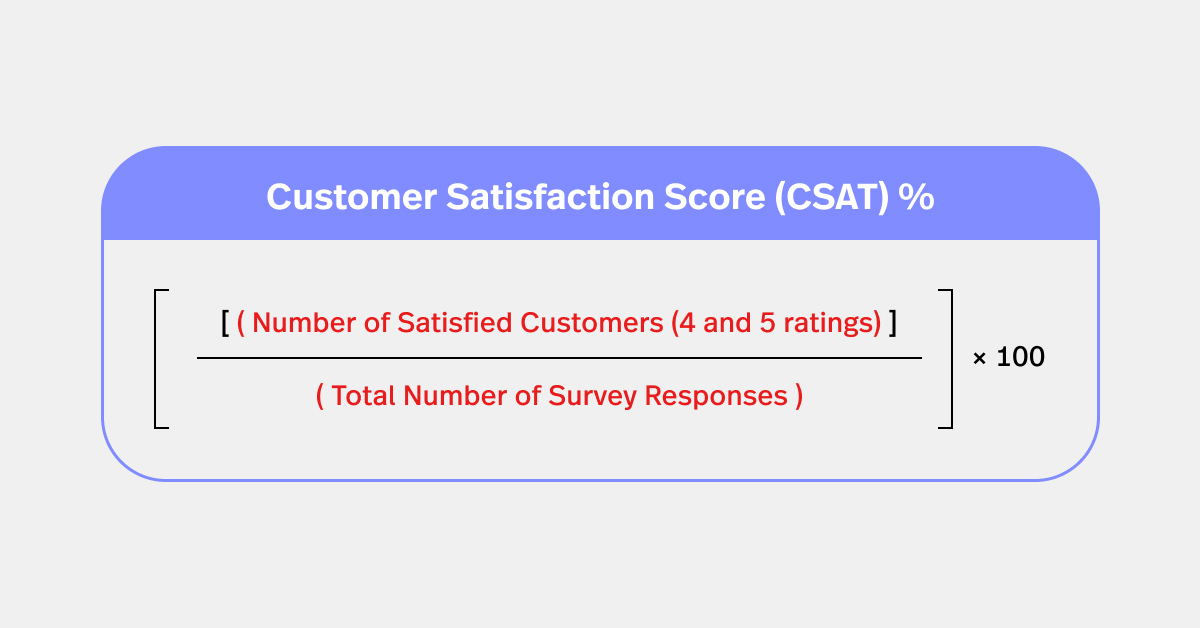
- Determine the percentage of customers who gave a score of 4 or 5 (if using a 5-point scale), or 9 or 10 (if using a 10-point scale).
The formula to calculate CSAT is:
CSAT (%) = (Number of Satisfied Customers (4 and 5 ratings) / Total Number of Survey Responses) * 100
For instance, if 80 out of 100 survey respondents gave you a score of 4 or 5, your CSAT score would be:
CSAT (%) = (80 / 100) * 100 = 80%
This means that 80% of your customers reported being satisfied with their experience.
17. Walk-ins vs. reservations
If your restaurant takes reservations, comparing the ratio of walk-ins vs. reservations can provide insights into your business’ operations and customer behavior. It can shed light on partners around dining preferences and can even inform decisions around staffing, table management and marketing strategies.
How to calculate walk-ins vs reservations
An easy way to surface this restaurant KPI is to:
- Add up the number of customers who made reservations and dined at your restaurant in a specific period (a day, week, month, etc.).
- Add up the number of customers who walked in without a reservation in the same period.
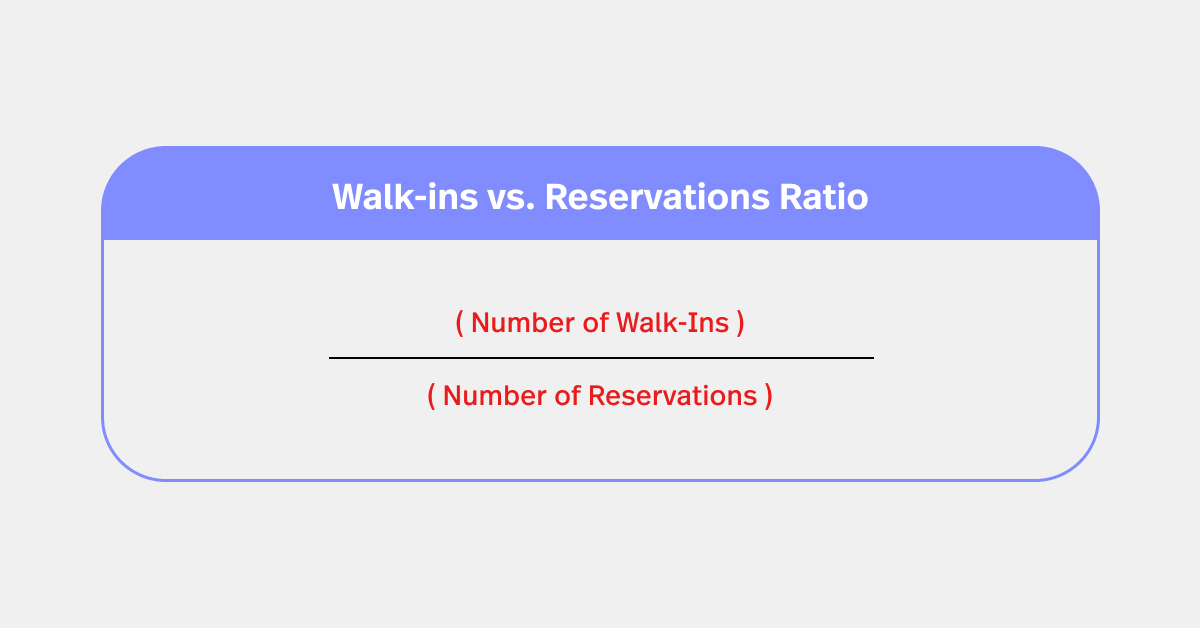
Then to calculate the ratio, divide the number of walk-ins by the number of reservations:
Walk-ins vs. Reservations Ratio = Number of Walk-Ins / Number of Reservations
For instance, if you had 60 walk-ins and 40 reservations on a given day, the ratio would be:
Walk-ins vs. Reservations Ratio = 60 / 40 = 1.5
This means you had 1.5 walk-ins for every reservation. This data can come in handy for forecasting staffing needs, adjusting reservation policies and optimizing table turnover.
18. No-shows
Another metric for restaurants that take reservations, the no-shows metric tracks the number of customers who made a reservation but didn’t turn up. A high rate of no-shows can significantly impact your restaurant’s operations and revenue, as you could have turned away potential customers expecting the reserved seats to be filled.
Depending on your no-show rate, you can consider policies around deposit requirements or try overbooking strategies to mitigate the impact of no-shows.
How to calculate no-shows
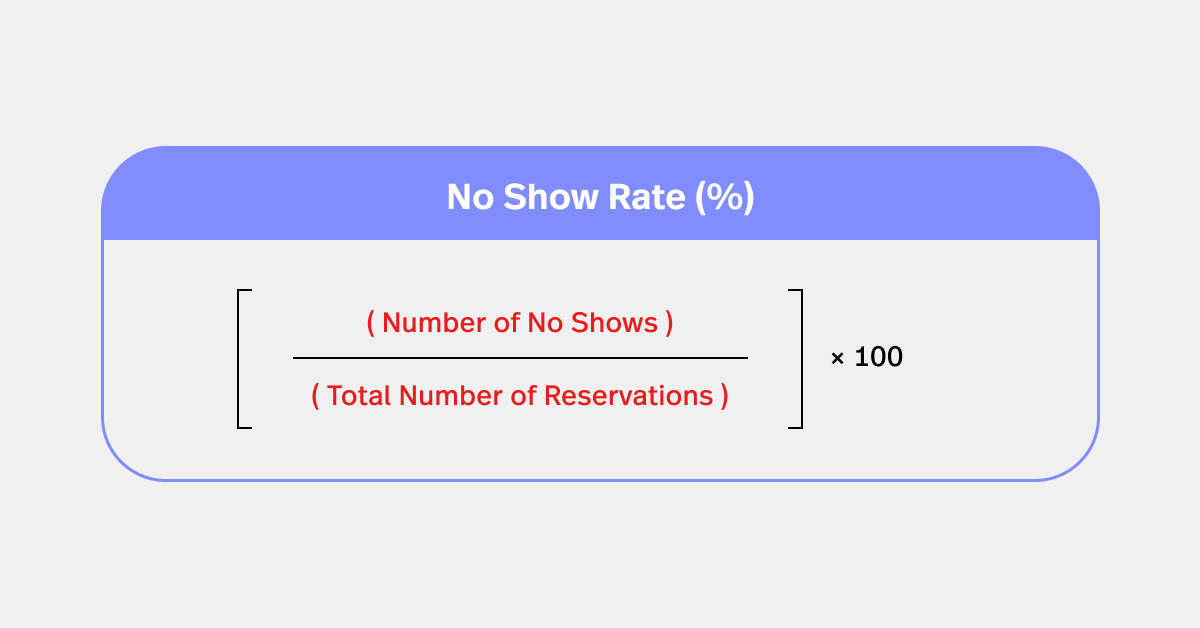
To calculate the No Show Rate, you can use the following formula:
No Show Rate (%) = (Number of No Shows / Total Number of Reservations) * 100
For example, if you had 100 reservations in a week, and 10 of those resulted in no-shows, your No Show Rate would be:
No Show Rate (%) = (10 / 100) * 100 = 10%
This means that 10% of your total reservations for that week were no-shows.
19. Cancellation rate
While not as bad as no-shows, a high cancellation rate can mean potential loss in revenue and disruption in planning. That’s why you’ll want to keep a close eye on this restaurant metric. It enables you to better manage your reservations, reevaluate booking policies and anticipate fluctuations in service demand.
How to calculate cancellation rate
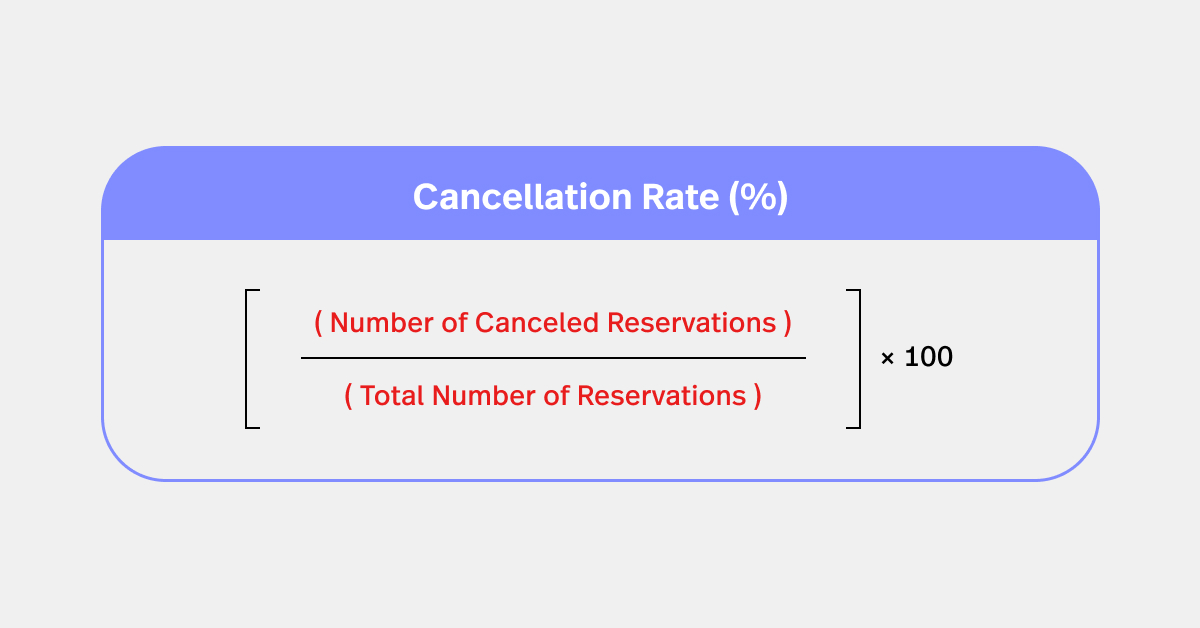
The formula for cancellation rate is
Cancellation Rate (%) = (Number of Canceled Reservations / Total Number of Reservations) * 100
For example, if you had 200 reservations in a month, and 20 of those were canceled, your Cancellation Rate would be:
Cancellation Rate (%) = (20 / 200) * 100 = 10%
This means that 10% of your total reservations for that month were canceled.
Technology and digital metrics
Tracking tech-related and digital metrics is vital if you want to adapt to the digital landscape and meet the expectations of modern guests. When you add these metrics to your list of restaurant KPIs, you can optimize your online presence, improve the customer experience and stay competitive in the digital era.
20. Online reservation rate
The online reservation rate measures the percentage of reservations made through online booking platforms or your restaurant’s website. It helps you evaluate the effectiveness of your online reservation system, assess customer preferences and make data-driven decisions to optimize the booking process.
How to calculate the reservation rate
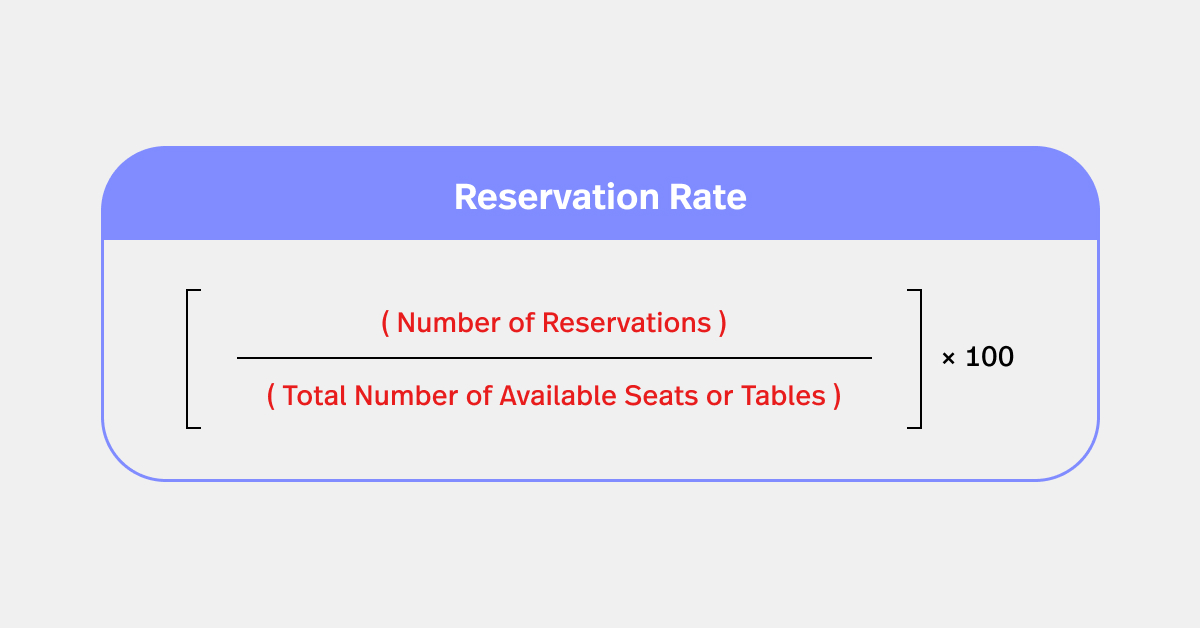
Calculating the reservation rate involves comparing the number of reservations made to the total number of available seats or tables in a given period. Here’s how to calculate it:
Reservation Rate = (Number of Reservations / Total Number of Available Seats or Tables) * 100
For example, if you had 50 reservations made for 100 available seats in a day, the reservation rate would be:
Reservation Rate = (50 / 100) * 100 = 50%
So essentially, about half of your available seats were reserved for that day.
21. Sales from online ordering
If you have your own online ordering system or you’re on platforms like DoorDash and Uber Eats, you’ll want to keep an eye on the revenue generated through these digital platforms. It helps you evaluate the success of your online/mobile ordering channels, measure customer adoption and optimize your ordering processes to capture a larger share of the market.
How to calculate sales from online ordering
Calculating sales from online ordering involves summing up the total revenue generated through online orders over a specific period.
Here’s how to calculate it: Sum up the total revenue generated from these online orders.
This total revenue represents your sales from online ordering. So, if your online ordering platform recorded $5,000 in sales during a month, then your sales from online ordering for that month would be $5,000.
22. Online ratings and reviews
Tracking your restaurant’s ratings and reviews across platforms like Yelp and Google allows you to monitor your reputation, gather customer insights and address feedback.
How to measure online ratings and reviews
Start by identifying online review platforms relevant to your restaurant, such as Google, Yelp, TripAdvisor, or specialized restaurant review websites.
From there, tally the number of ratings and reviews received within a specific period, such as a week, month, or year. Next, analyze the overall rating based on the average score or star rating given by customers.
This can be calculated by summing up all the ratings and dividing by the total number of reviews.
For example, if you received 50 reviews with an average rating of 4.5 stars, your overall rating would be 4.5 stars.
Competitive analysis: comparing your KPIs against competitors
Tracking these 22 restaurant KPIs will help you understand what’s going on inside your four walls; but, with strong competition, rising costs and ever-evolving consumer tastes, knowing how you’re doing within the confines of your restaurant is table stakes.
As you work to grow and scale your business, understanding how your performance metrics compare to your competitors’ will become increasingly important. This is where benchmarking comes in.
Benchmarking lets you compare your performance to your competitors, giving you a holistic view of both your performance and the broader market, so you can:
- Understand how you measure up to direct competitors in your local market.
- Spot new trends and opportunities (and then capitalize on them).
- Diagnose and correct service issues, so things run smoothly and guests leave happy.
- Verify market demand before making costly operational decisions.
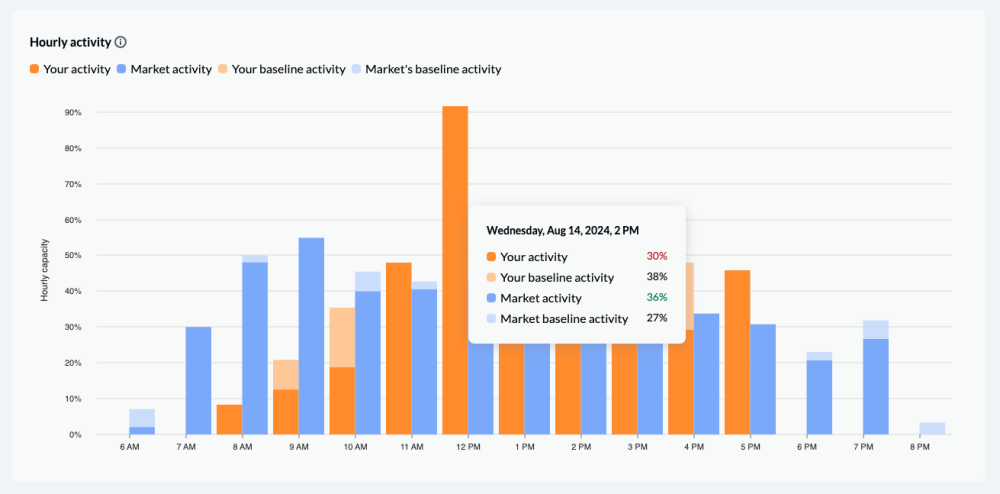
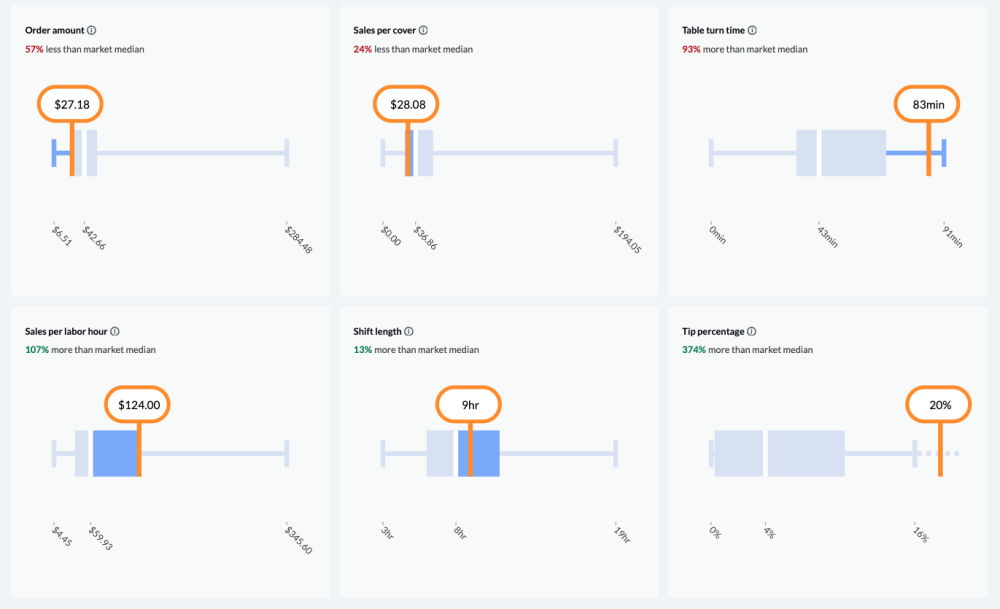
Benchmark software like Lightspeed’s Benchmarks & Trends empowers you with personalized benchmarks—taking into account your concept, size, location, etc.—that go beyond industry averages, allowing for meaningful and actionable insights into your sales, menu, service and operations. For example:
Hourly sales performance:
Price points:
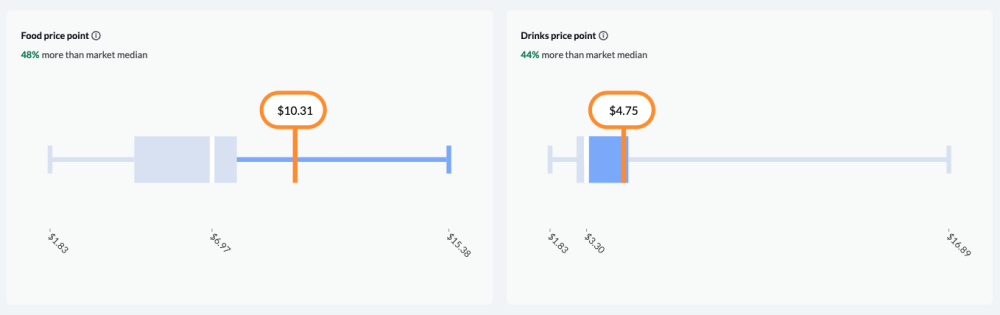
Service and operations:
Learn more about restaurant benchmarks in Lightspeed Restaurant.
Final words on restaurant KPIs and and tracking restaurant metrics
Embracing a data-driven approach empowers you to adapt to changing market dynamics, meet customer expectations and position your establishments for long-term success in the competitive hospitality industry.
Remember, you can’t make great decisions without the right info and the only way to get that intel is to track your restaurant metrics, aka restaurant KPIs.
Need help doing just that? Lightspeed Restaurant offersAdvanced Insights that go beyond traditional sales reports and the trailblazing new feature Benchmarks & Trends.
Ready to find out what Lightspeed can do for your business? Talk to a POS expert today.

News you care about. Tips you can use.
Everything your business needs to grow, delivered straight to your inbox.