Reporting and analytics are essential to any retailer because they tell you exactly what’s going on in your business. Analyzing your data correctly enables you to make well-informed decisions around things like stock ordering, promotions and staffing.
However, having too much data (or worse—looking at the wrong info) can lead to mishaps, stress and a lot of business headaches. That’s why it’s important to run the right reports for your retail stores.
Need help doing that? We’ve put together a list of the top retail reports to monitor in your business. So the next time you log into your inventory management software, you can keep an eye out for the following items we’ll cover in this article. Let’s get started.
Table of contents
- What are inventory and sales reports in retail?
- Why are inventory and sales reports important?
- 7 key metrics retailers should track in inventory and sales reports
- Types of Inventory analysis reports for retail stores
- Retail sales analysis reports
- How to use inventory and sales reports to grow your retail store
- Retail reporting best practices
Inventory Spreadsheet Template
Download this free inventory spreadsheet to help you better manage your stock, purchases and sales.
What are inventory and sales reports in retail?
Inventory and sales reports are essential retail store analysis reports that help businesses track performance and make informed decisions. An inventory analysis report helps retailers avoid both stockouts and overstocking by showing:
- What stock is available
- What has been sold
- What needs to be reordered
A sales report, on the other hand, summarizes revenue performance over a specific period, including:
- Top-selling products
- Sales trends
- Customer demand patterns
Together, these reports give retailers a complete view of how products are moving through the business, enabling better forecasting, smarter purchasing decisions, and improved profitability.
Why are inventory and sales reports important?
Running reports when you’re trying to run your own business can seem tedious. But, once you get the hang of regularly running and automating your reports, knowing exactly what to look for once you do, the benefits of reporting will quickly make themselves apparent.
Here are a few reasons explaining why your business will reap the benefits of reporting, if you’re still a bit unsure:
Manage your inventory better
We’re probably not blowing your mind with this one, but suffice to say, running inventory reports will help you manage your inventory easier than you currently are.
Regular reporting can help improve transparency so you can ensure that stock levels are accurate, preventing overstocking or stockouts. They also help in improving your ordering processes with regard to ensuring you have plenty of popular stock while you reduce the order of slow-moving items. Inventory reports can even help identify discrepancies that may indicate theft, damage, or administrative errors.
Understand what’s selling and what’s not
We’re sure you’ve noticed when an item or service you’re selling is performing better than expected. But, why leave it up to chance that you recognize which items are selling well? Sales reports provide insights into what’s performing well and what isn’t, and from that, you can also identify trends and seasonal variations. Once you know what’s selling well, you can make sure you’re ordering more of the right stuff, and similar items you think your customers might be interested in to meet demand better.
Improve customer satisfaction
Don’t leave your customers in the lurch. Succeeding as a retail business lies in your ability to proactively meet demand, rather than reacting to it. Of course, we imagine you’re not clairvoyant, but with sales reports and forecasts, you don’t have to be. Simply work out what’s sold well each year at particular times in the year, and order stock to meet demand before your customers even walk through the door.
Sales reports can also be used to personalize marketing efforts and deliver loyalty programs. The more you know about what your customers like, the better you can reward them for repeated custom.
Improve marketing and sales strategies
By delving into the data, you move beyond guesswork and gain a clear, evidence-based understanding of what resonates with your customers and what doesn’t.
Think of it this way: by recording and analyzing your past, your reports become a compass for the future. Tracking trends in your sales data means you can identify your best-selling products, pinpoint peak shopping times and understand customer demographics and preferences. This allows you to tailor your marketing messages more effectively, ensuring they reach the right audience with the right offer at the opportune moment.
For example, if your sales reporting indicates a surge in a particular product category during specific periods, you can proactively launch targeted marketing campaigns and promotions to capitalize on that demand. Similarly, understanding which marketing channels drive the most sales allows you to optimize your ad spend and focus your efforts where they will yield the highest return.
Understand upcoming trends
Beyond optimizing current strategies, consistent engagement with your sales reporting and inventory analysis reports empowers you to become a trend spotter in your own business. Reports act as an early warning system, revealing subtle shifts in customer behavior and product popularity before they become widespread.
Aggregated data helps you pinpoint trends easier than trying to track them manually. A gradual increase in sales for a particular niche product, or a consistent uptick in a certain color or material, could signal an emerging consumer preference, and could be easily missed if it weren’t for reporting giving you a bigger picture than you can get from different employees managing day-to-day sales totals.
7 key metrics retailers should track in inventory and sales reports
To get the most value from inventory and sales data, retailers should monitor key performance indicators (KPIs) that reveal product demand, inventory efficiency, and overall business performance. Tracking these metrics through inventory analysis reports and sales reports can help retailers make smarter purchasing, pricing, and stocking decisions.
1. Inventory turnover ratio
Inventory turnover measures how often inventory is sold and replaced during a specific period. A higher turnover ratio generally indicates strong sales and efficient inventory management, while a lower ratio may signal overstocking or slow-moving products.
2. Sell-through rate
Sell-through rate compares the amount of inventory sold against the amount received from suppliers. This metric helps retailers evaluate product performance and identify which items are selling faster than expected.
3. Stockout rate
Stockout rate measures how frequently products are unavailable when customers want to purchase them. Monitoring this metric helps retailers avoid lost sales and improve replenishment planning.
4. Gross sales and net sales
Sales reports should track both gross sales and net sales. Gross sales represent total revenue before discounts and returns, while net sales provide a more accurate picture of actual revenue generated.
5. Average transaction value (ATV)
Average transaction value measures how much customers spend per purchase. Retailers use this metric to evaluate sales performance and identify opportunities to increase basket size through promotions or product recommendations.
6. Gross margin
Gross margin shows how much profit remains after deducting the cost of goods sold (COGS). This metric helps retailers assess product profitability and make informed pricing decisions.
7. Days of inventory on hand (DOH)
Days of inventory on hand estimates how long current inventory will last based on sales velocity. This metric helps retailers balance inventory levels and reduce carrying costs.
Types of Inventory analysis reports for retail stores
Keeping your product assortments fresh and relevant is a must if you want to stay in business, so track your inventory like a hawk. You can do that with the following types of inventory reports:
1. Inventory on hand
You always want to know how much merchandise you have in your stores, so if there’s a report that you should run regularly, it should be this one.
Your “inventory on hand” report should show how many product units you have in each store as well as the current stock value. That information tells you how much capital you have in your inventory, which in turn can help you in your financial plans and forecasts.
Teskey’s Saddle Shop, for example, reduced the time it spent managing inventory by 75% after implementing Lightspeed’s stock management tools. The team now has accurate, real-time inventory information and can quickly identify products that have been sitting on the shelves for too long.
As IT Manager Jordan Cooper explains, “Reports tell us important things like, ‘This product has been around for seven years, you’ve only sold four, and you still have 30 left.'”
2. Low stock
Out of stocks are a no-no in retail. Not only do they lead to lost sales, but out-of-stocks also result in reduced customer satisfaction and can send people straight to your competitors.
Prevent that by regularly generating stock reports that display items that are running low. For best results, set a reorder point for your products and make sure that you’re notified when your stock levels reach a certain point so you can replenish as necessary.
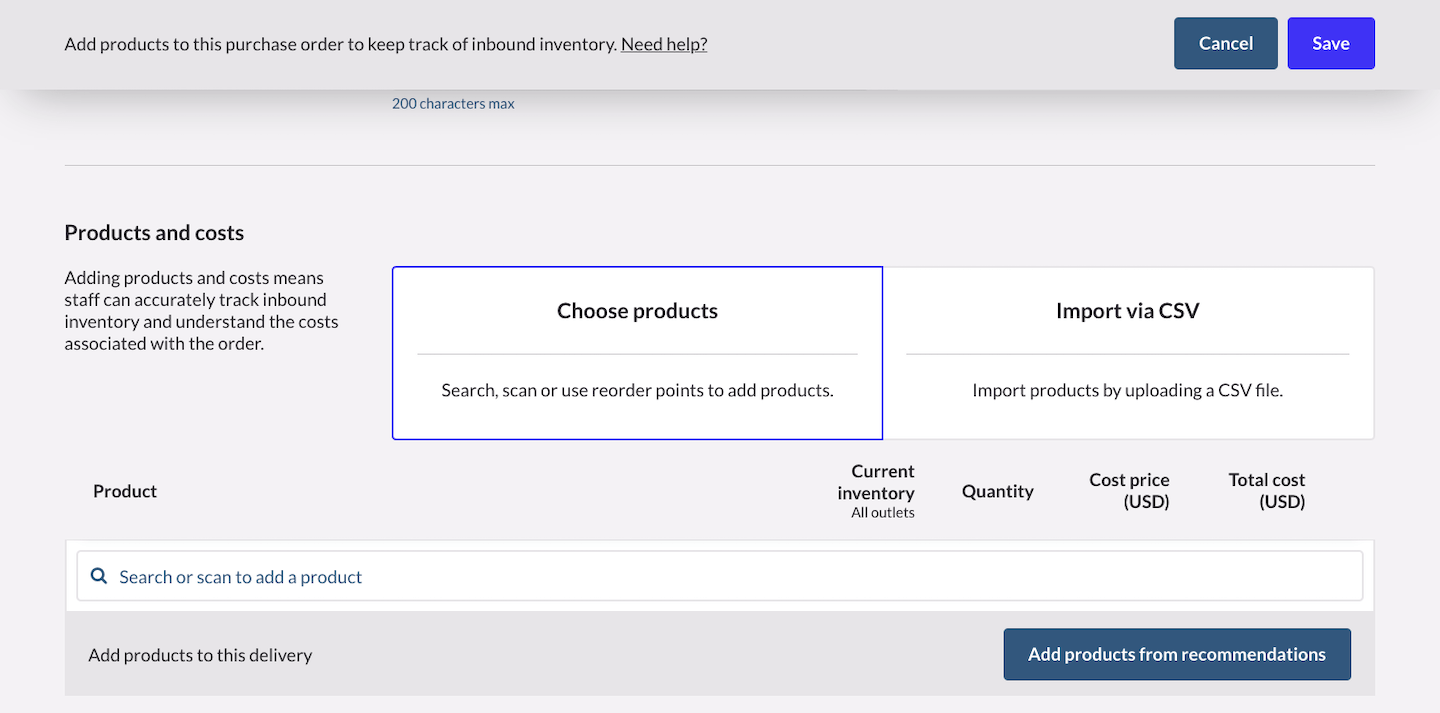
Lightspeed uses reorder points to calculate exactly how much you need to order.
Looking at low stock reports on a regular basis can also enable you to spot patterns around which products are constantly running low. If a particular is always showing on this report, for instance, that could indicate the need to increase your order quantities.
3. Product performance report
How fast are items selling? Which products are making the most money? Such questions can be answered by your product performance report.
Ideally, this report should tell you how much merchandise you’ve sold over a given time period as well as a summary of items sold per month or per week. Use the product performance report to determine which items are worth investing in and which ones shouldn’t be re-ordered.
A good product performance report should tell you the date of the last sale for that product. If there’s a big gap between the last sale date and the current date, then that may indicate that an item isn’t selling as fast as it should.
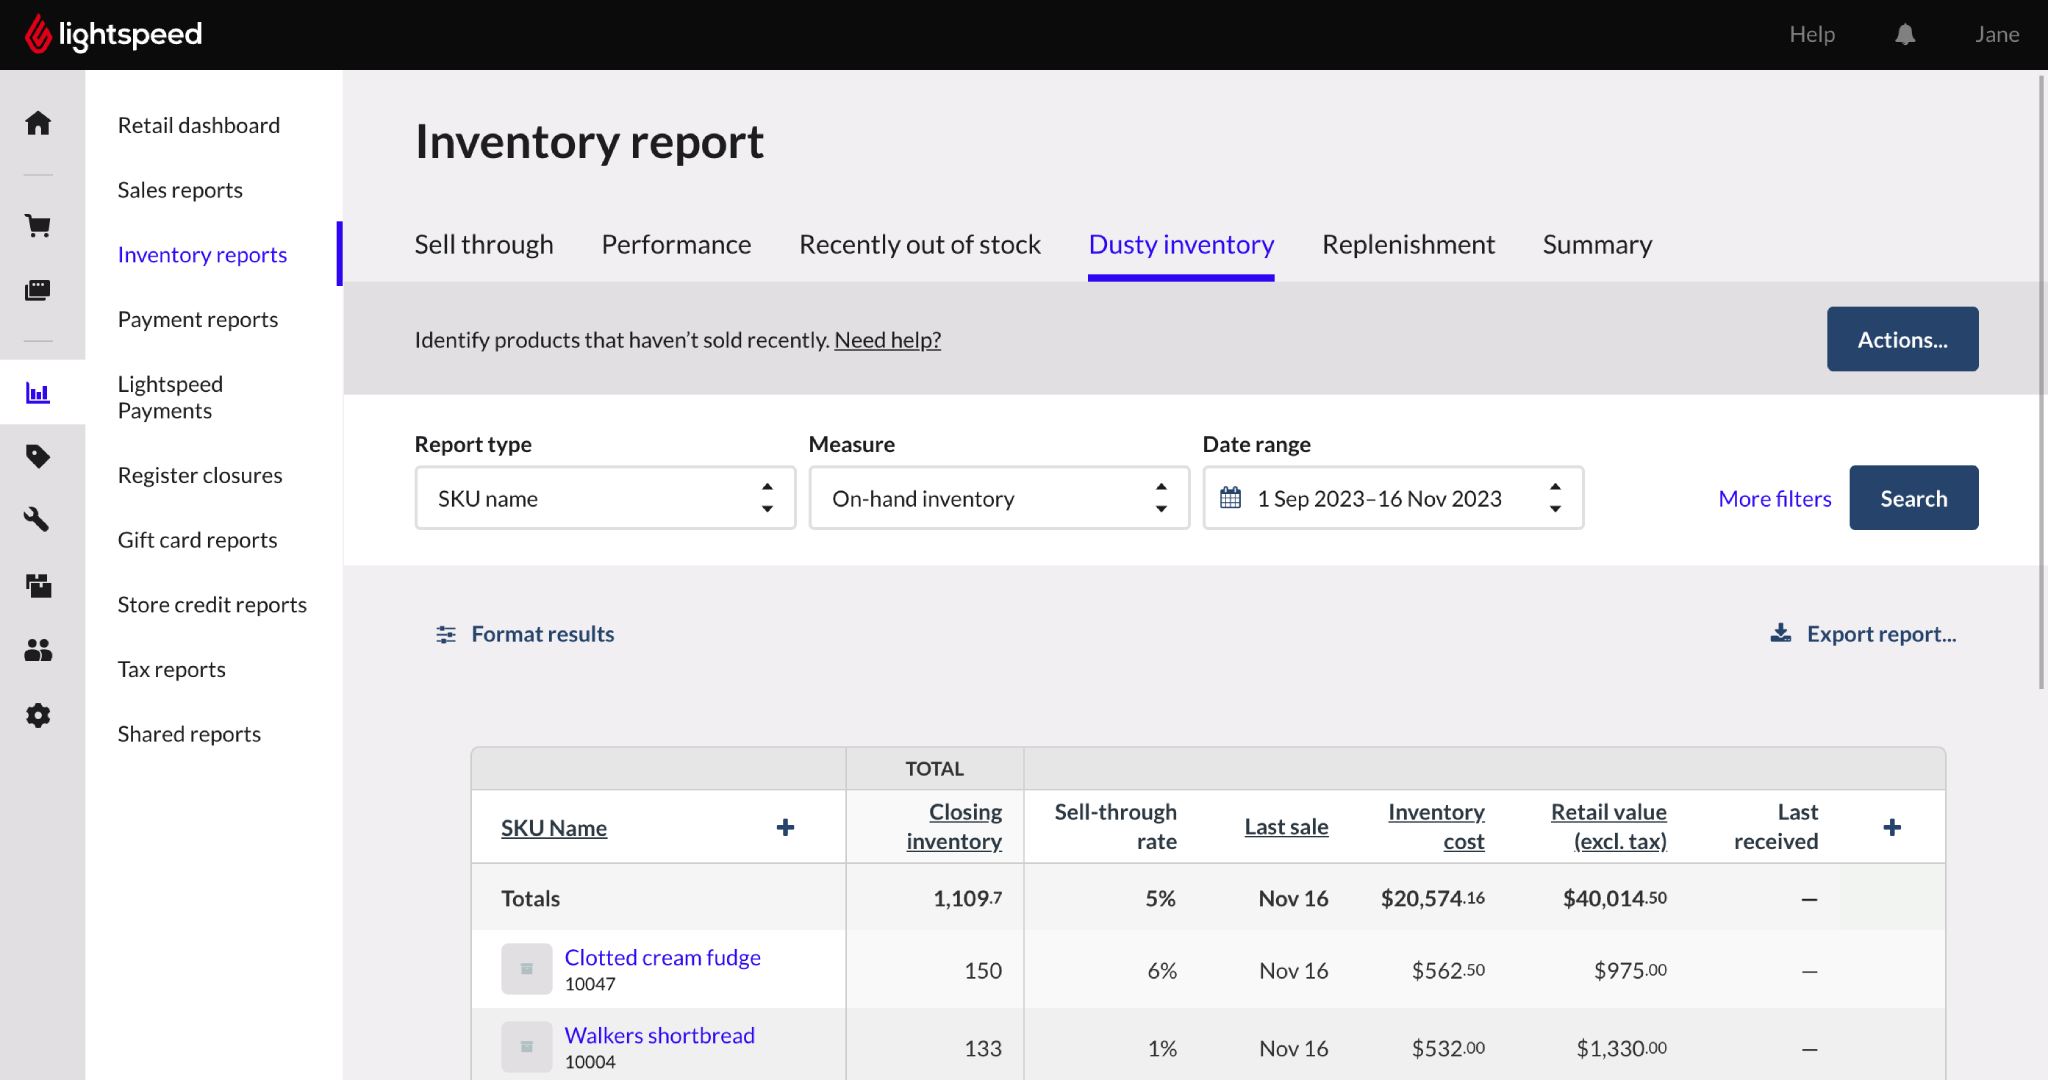
Dusty Inventory report by Lightspeed
Christmas Elves, a store that sells holiday goods and decor, uses product performance reports extensively in their business. According to Jason McIntyre, owner of Christmas Elves, he’s always looking at how fast items are selling per week and uses that to make stock ordering decisions.
By looking at when sales spike and which products are selling the most, Jason and his team can get a clearer idea of how many units to order. Jason says he also tracks sales velocity reports for specific products and their overall categories, and this gives him an idea of which related products to sell in his store.
4. Cost of goods sold (COGS) report
A COGS report details the direct costs attributable to the production and/or procuring of the goods sold by your retail business.
You should run this report at the end of every accounting period (monthly, quarterly and annually) to accurately calculate your gross profit and assess the true profitability of your sales. A consistently high COGS relative to sales might indicate inefficiencies in purchasing or production.
5. Purchase order report
Purchase order reports, particularly when integrated with demand forecasting, help retailers proactively manage their inventory by creating informed purchase orders. In Lightspeed, this report combines historical sales data with supplier lead times to predict future demand.
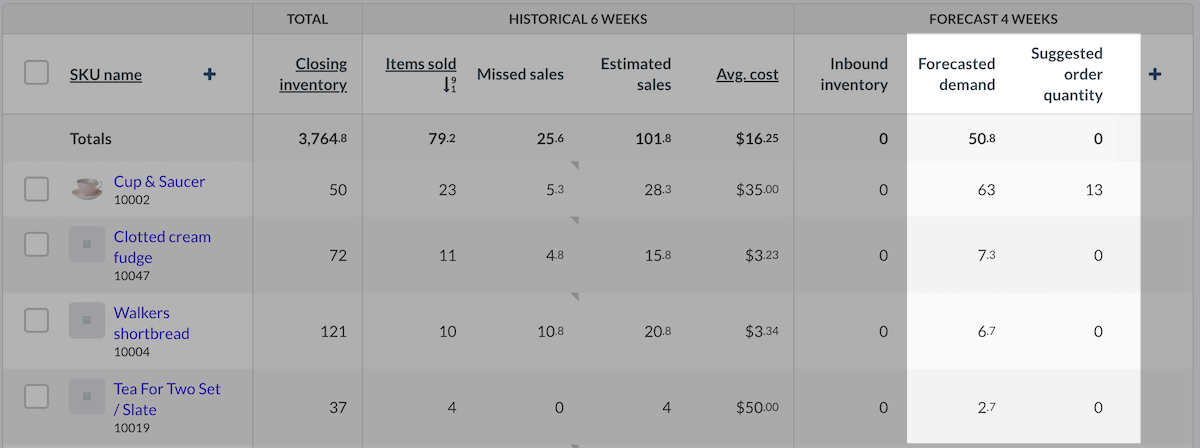
Forecasted demand in Lightspeed Retail
Run this report when reviewing stock levels or planning for seasonal changes. It’ll give you the ability to reorder inventory with far greater accuracy, preventing both costly overstock situations and missed sales opportunities due to understocking.
6. Customer analytics reports
A customer analytics report provides an invaluable lens into your customer base, offering actionable insights by dissecting various aspects of their interactions with your store.
Rather than be one report, this is a type of report, analyzing different aspects of the customer journey as they interact with your business. For example, reports like Lightspeed’s return count and returns percentage reports help identify trends in product satisfaction or potential issues with specific items or customer segments, allowing for proactive adjustments.
A report that counts the amount of sales with named customers attached reveals your store’s reach and growth in unique patrons and returning shoppers over time, while a sales summary by customer or customer group report allows you to understand individual customer spending habits and the collective value of different demographics.
7. Inventory profitability reports
Inventory profitability reports go beyond basic profit margins by leveraging specific measures to illuminate the true financial health of your stock.
An overall performance report, especially when broken down by product, reveals which items are contributing most to your bottom line, factoring in their selling price and cost. Drilling down deeper into your sell through rates indicate how quickly inventory is moving, directly correlating to efficient capital utilization and strong sales performance.
The Plus Factor uses Lightspeed reports to identify overstocked and understocked categories, pinpoint individual items that need to sell through and make more informed purchasing decisions. The retailer says this improved inventory visibility helped the business grow by 50%.
As Marketing Manager Becky Boileau explains, “We hired someone to plan our inventory and with Lightspeed, she can pull all the necessary reports, letting us know which categories are overstocked or understocked and what individual items we need to sell through.”
But knowing what’s selling well is only half of the picture. Insights into your dusty inventory—items sitting too long on shelves—highlight capital tied up in underperforming stock, impacting cash flow and profitability. And monitoring recently out of stock items, while seemingly a negative, actually points to missed sales opportunities on popular products, indirectly impacting potential profitability.
8. Inventory turnover report
An inventory turnover report measures how quickly inventory is sold and replenished over a specific period. It helps retailers evaluate inventory efficiency by showing which products are moving quickly and which are tying up capital on shelves.
This report typically tracks inventory turnover by product, category, or store location. High turnover rates often indicate strong demand and effective inventory management, while low turnover rates may signal overstocking or slow-moving products.
By reviewing inventory turnover reports regularly, retailers can make smarter purchasing decisions, reduce carrying costs, improve cash flow, and optimize stock levels across their business.
9. Dead stock report
A dead stock report identifies inventory that has not sold for an extended period and is unlikely to generate revenue without intervention. These products tie up valuable capital, occupy storage space, and can increase inventory carrying costs.
Retailers should review dead stock reports regularly to identify slow-moving or obsolete items. The insights from this report can help inform markdown strategies, promotional campaigns, product bundling, returns to suppliers, or liquidation efforts. By addressing dead stock proactively, retailers can free up cash flow, optimize inventory levels, and create space for higher-performing products.
10. Inventory valuation report
An inventory valuation report shows the total financial value of inventory currently on hand. It typically includes inventory quantities, unit costs, and the overall value of stock across products, categories, or locations.
This report plays an important role in financial reporting, budgeting, and inventory planning. Retailers use inventory valuation reports to understand how much capital is tied up in stock, assess inventory investments, and make informed purchasing decisions. Regularly reviewing inventory valuation data can also help businesses maintain accurate financial records and identify opportunities to improve inventory efficiency.
Retail sales analysis reports
Sales are critical to retail success, which is why you always need a clear idea of how much money is coming into your business. Here are some of the retail sales report types that can provide the best insights:
1. Sales summary
This report gives you an overview of your sales for a given time period. Your sales report should also show your cost of goods sold, gross profit, margins, and tax, so you can have a better idea of how much money is actually going back to your business.
The sales summary report provides a more macro view of your retail sales. How much did you make last month or the previous month? What about your year-to-date sales compared to last year? These numbers offer some general insights around the health of your business, and they can inform your medium to long-term decisions.
2. Sales report per product and product type
Having an overview of sales is great, but to get even more meaningful insights, you also need to be granular with your analytics. This is where sales per product reports come in.
This type of report makes it easy to identify your best (and worst) selling products, so you can determine the right course of action. If a particular product is selling well, for example, you could consider ordering more of it. On the flip side, if a product isn’t performing, then you’d want to know sooner rather than later so you can run promotions before the season ends.
Sales per product type, on the other hand, helps you get a handle on your revenue from a category level. This is a great report to run if you want to identify broader trends or insights.
Let’s say you’re a footwear retailer and you notice that a particular brand or style of shoes is quickly gaining in popularity. Or, perhaps you’ve noticed that certain shoe sizes sell more quickly. You can use those insights to influence your stock ordering and marketing decisions for the rest of the season.
Bells Shoes, a UK-based retailer of branded footwear is doing exactly that. Detailed reports have been a big win for them. According to the Bells Shoes team:
One simple, but effective, feature is the ability to view sales and stock grouped by variation as at SKU level. For a shoe retailer, this allows us to view sales by style, as well as sales by size/colour – something we’ve never had before.
3. Sales report per customer or customer group
It’s a good idea to generate “sales per customer” or “sales per customer group” reports. This will allow you to identify your VIP customers as well as those who aren’t fully engaging with your brand, so you can tailor your marketing and communications accordingly.
If you know who your top customers are, you could create special VIP events or programs to drive loyalty. On the other hand, if you’re looking to engage inactive customers, this report will help you identify them easily.
4. Sell-through report
Sell-through is a retail metric that tells you how fast an item is selling. It’s expressed as a percentage of units sold versus the number of units available to be sold.
Some reporting platforms may have the sell-through metric as a separate report, though other solutions can have this under the Product Performance.
5. Lead conversion report
A lead conversion report measures the effectiveness of your sales process by tracking the percentage of potential customers (leads) who complete a desired action, such as making a purchase.
This type of report typically analyzes the entire sales funnel, from initial customer interaction to completed sale, and is often one that’s easier tracked for ecommerce than brick and mortar sales.
You should run this report regularly, at least monthly, to evaluate the performance of your marketing campaigns and sales team. It’ll help you gain critical insights into where prospects might be dropping off in their buying journey, helping to identify bottlenecks in the sales process or areas for improvement in product presentation or customer service.
6. Sales forecast report
A sales forecast report utilizes historical sales data to predict future sales trends and expected demand. This kind of report helps retailers anticipate what products will be popular and when, taking into account factors like seasonality and past performance.
You should run a report like this periodically, often monthly or quarterly, and especially before major selling seasons or marketing pushes to inform your strategic planning.
7. Sales by location report
A sales by location report compares sales performance across different stores, regions, or sales channels. It typically tracks metrics such as revenue, transaction volume, units sold, and average order value for each location.
This report helps retailers identify top-performing and underperforming locations, enabling more informed decisions around inventory allocation, staffing, marketing investments, and expansion strategies. For multi-store retailers, sales by location reports can reveal regional buying patterns and help ensure inventory is distributed where demand is highest.
8. Sales by employee report
A sales by employee report measures individual staff performance by tracking metrics such as total sales, number of transactions, average transaction value, and units sold per employee.
Retailers use this report to identify top performers, evaluate productivity, and uncover coaching opportunities for team members who may need additional support. Sales by employee reports can also be used to inform commission programs, performance reviews, and staffing decisions. By monitoring individual contributions, retailers can build stronger sales teams and improve overall store performance.
How to use inventory and sales reports to grow your retail store
Inventory and sales reports are most valuable when they are used to drive action. By regularly reviewing inventory analysis reports and sales data, retailers can identify trends, improve operational efficiency, and make smarter business decisions.
Start by using inventory reports to optimize stock levels. Low-stock, inventory-on-hand, and turnover reports can help you avoid stockouts, reduce excess inventory, and ensure capital is invested in products that are actually selling.
Sales reports can reveal your top-performing products, categories, locations, and employees. Use these insights to allocate inventory more effectively, expand successful product lines, and replicate winning sales strategies across your business.
Retailers can also leverage historical sales data to improve demand forecasting. Understanding seasonal trends, sales velocity, and customer purchasing patterns makes it easier to plan promotions, adjust purchasing decisions, and prepare for peak selling periods.
Additionally, profitability, COGS, and inventory valuation reports help identify opportunities to improve margins by reducing carrying costs, eliminating dead stock, and optimizing pricing strategies.
When used consistently, retail reporting transforms raw data into actionable insights that support better forecasting, stronger inventory management, higher profitability, and sustainable business growth. Regularly reviewing your retail store analysis report ensures decisions are guided by data rather than guesswork.
Retail reporting best practices
The process for generating these reports will depend on your POS or retail management system, but here are a few general tips and information to keep in mind:
- Keep your POS system and inventory management in sync – Don’t keep your data “all over the place.” See to it that your point of sale and inventory management systems are synced. The best approach is to choose a system that has POS and inventory management features available on one platform, so all your data lives in one system. If that’s not possible, then you should ensure that your POS and inventory solutions are tightly integrated. You need data to flow seamlessly from one system to the next so you can easily generate accurate and up-to-date reports.
- Arm yourself with a flexible retail analytics solution – Make sure your retail analytics solution lets you slice and dice your reports to fit your needs. If you really want to get the most out of your retail analytics, you need a system that enables you to filter and view information in different ways. Rather than just giving general sales reports, your analytics platform should also have the option to filter the data — i.e., by product type, customer group, category, etc. Doing so will help you segment your data in ways that make the most sense for your business.
- Make sure it runs in the cloud – A cloud-based system lets you track your business from anywhere (as long as you have an Internet connection). This is especially handy if you’re running multiple stores or are constantly on-the-go because you’ll be able to check in on your stores — and make data-backed decisions — even when you’re not there physically. Picture yourself travelling to an industry trade show or expo and trying to decide which products to buy for your store. Rather than going in blind, you can just log in to your POS or inventory platform to see the products your customers can’t get enough of.
FAQs about inventory and sales reports
What are the most important retail sales reports?
The most important retail sales reports include sales summary reports, product performance reports, sales by location reports, sales by employee reports, and customer analytics reports. Together, these reports help retailers track revenue, identify top-selling products, evaluate store and employee performance, and better understand customer behavior. When combined with inventory analysis reports, they provide a complete view of business performance.
What is a store performance evaluation?
A store performance evaluation is the process of assessing how well a retail location is performing against key business goals. It typically involves analyzing metrics such as sales revenue, gross margin, inventory turnover, average transaction value, customer retention, and employee productivity. Retailers use store performance evaluations to identify strengths, uncover operational issues, and make data-driven improvements.
What are KPIs in retail?
Key Performance Indicators (KPIs) are measurable metrics used to track the health and success of a retail business. Common retail KPIs include sales growth, inventory turnover, sell-through rate, gross margin, average transaction value, conversion rate, and customer retention rate. Monitoring these KPIs through retail reporting helps retailers measure progress and make informed decisions.
What are the key benefits of sales reporting?
Sales reporting provides visibility into revenue trends, product performance, customer purchasing behavior, and overall business health. It helps retailers identify growth opportunities, forecast demand more accurately, optimize inventory levels, and improve profitability. Regular sales reporting also enables faster decision-making by turning raw sales data into actionable business insights that support long-term growth.
Ready to upgrade to a POS with actionable data? Then you need Lightspeed.

News you care about. Tips you can use.
Everything your business needs to grow, delivered straight to your inbox.